made with marimo
Get inspired by this curated gallery, made with marimo: the open-source reactive Python notebook.
Share your molab notebook on socials and tag us for a chance to be featured: X · LinkedIn · Bluesky · Reddit
🏆 We're running a notebook competition with alphaXiv — now on GPUs. Pick a paper, build a notebook, & win prizes 👀
Get inspired by this curated gallery, made with marimo: the open-source reactive Python notebook.
Share your molab notebook on socials and tag us for a chance to be featured: X · LinkedIn · Bluesky · Reddit
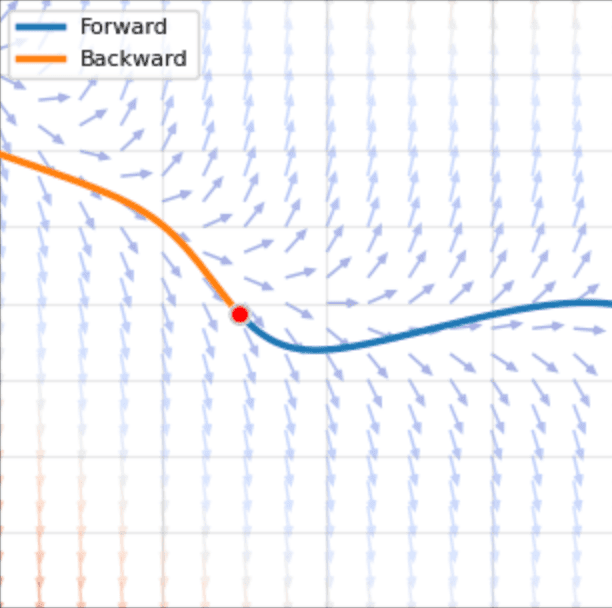
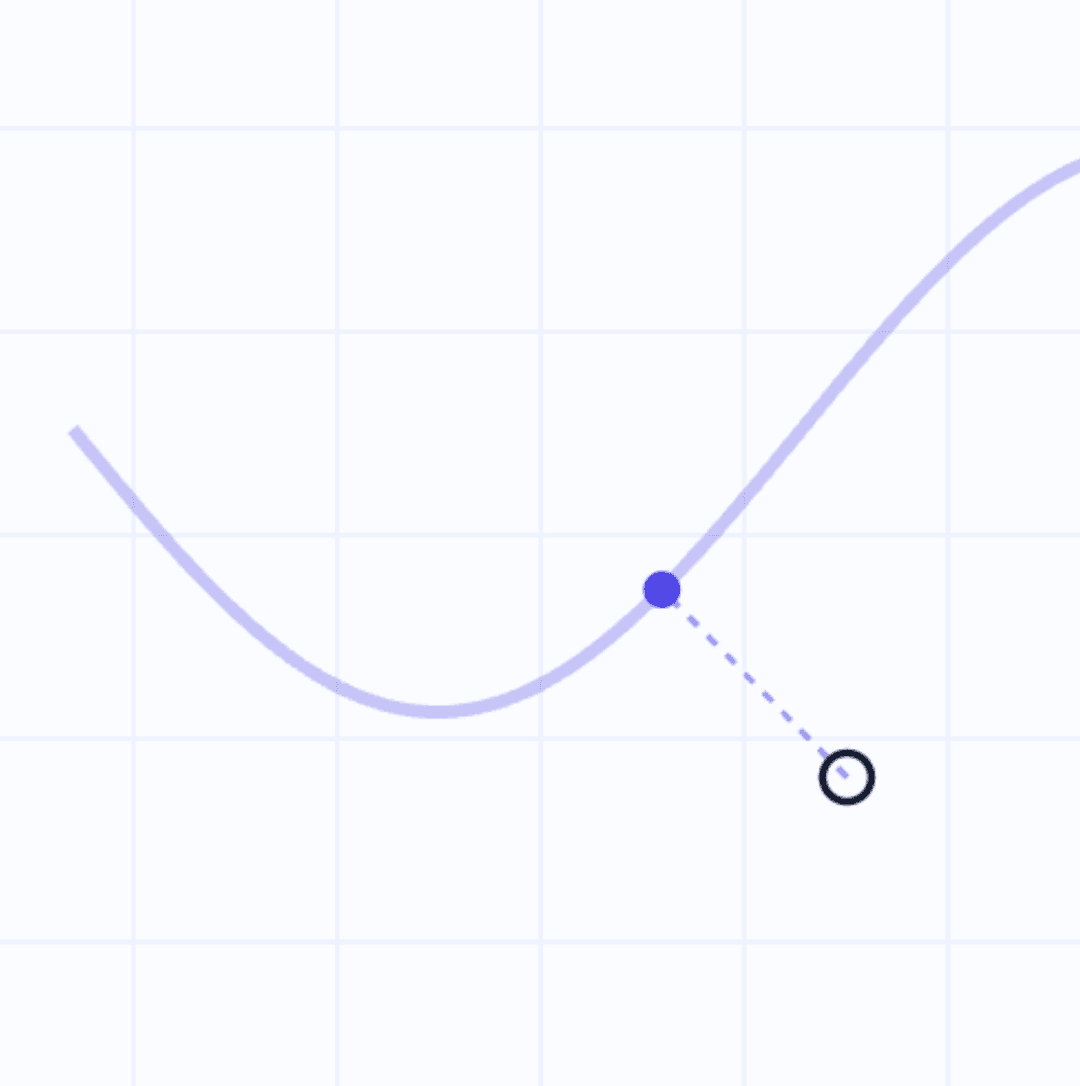
Interactive ODE solver with a draggable initial condition and direction field visualization.
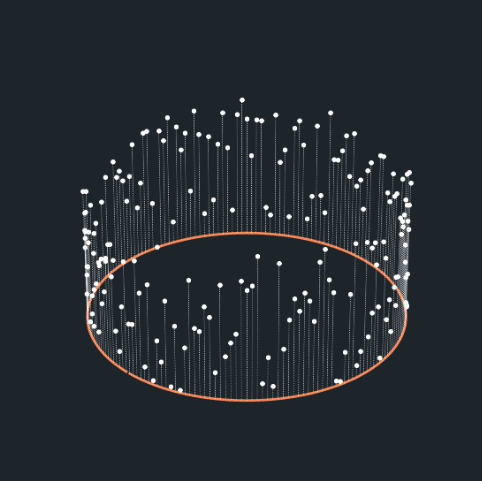
Interactive 3D visualization of the Bak-Sneppen model of self-organized criticality.
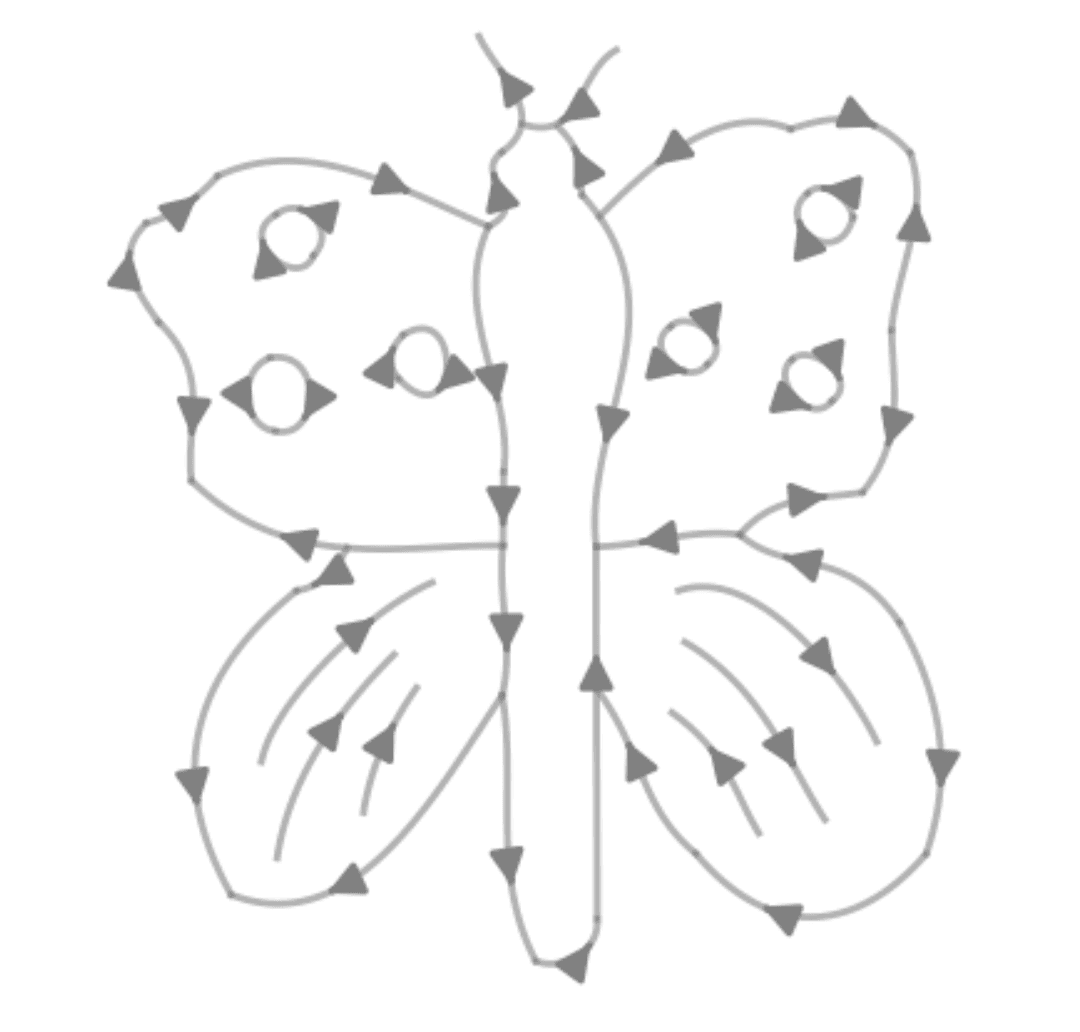
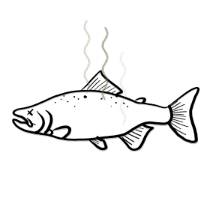
Convert hand-drawn sketches into SVGs using deep learning and Bézier curve fitting.
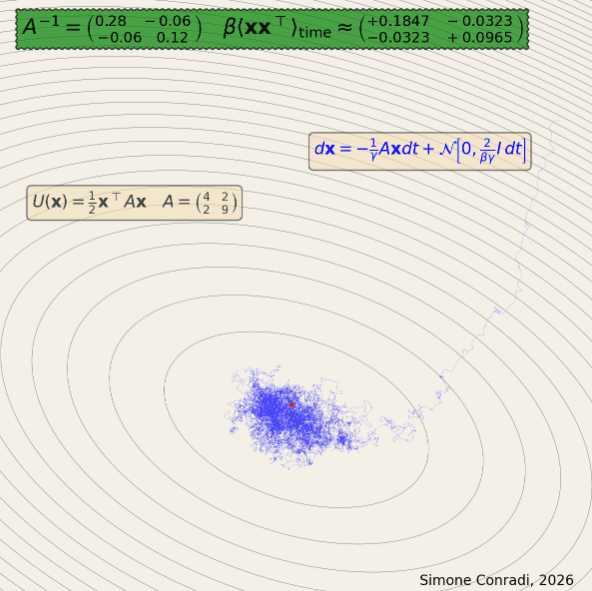
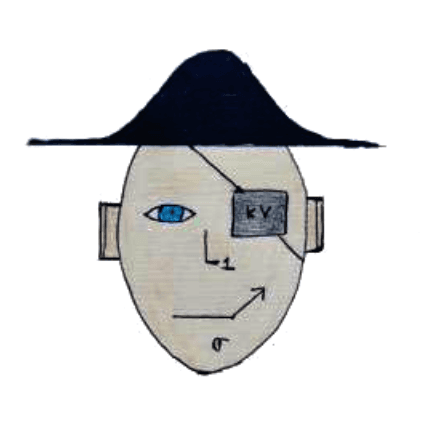
Estimating the inverse of a matrix using thermodynamic principles with interactive visualizations.
Interactive false-positive traps showing how feature attribution, probing, SAEs, and circuits 'find' structure in pure noise.
Why diffusion models don't need noise conditioning, derived in closed form on a toy circles dataset.
by FarseenSh
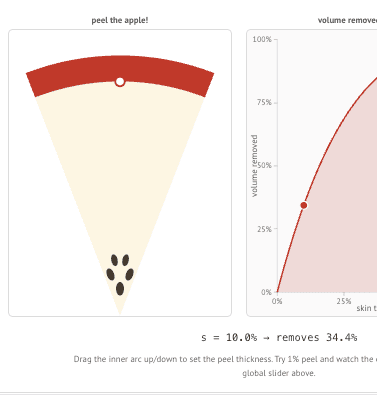
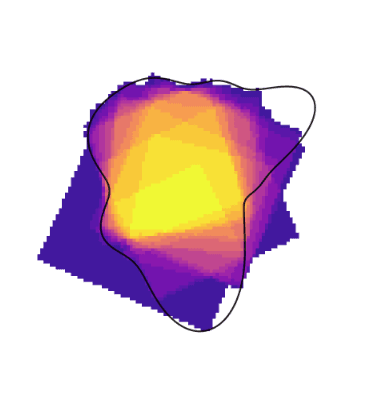
A diffusion model attacks the 100-year-old inscribed square problem by drawing (CVPR 2026).
by Akash Sharma
A paper explainer for 'Diverse Task Experts Are Dense Around Pretrained Weights' with interactive loss landscapes and a RandOpt implementation.
by Parul Pandey
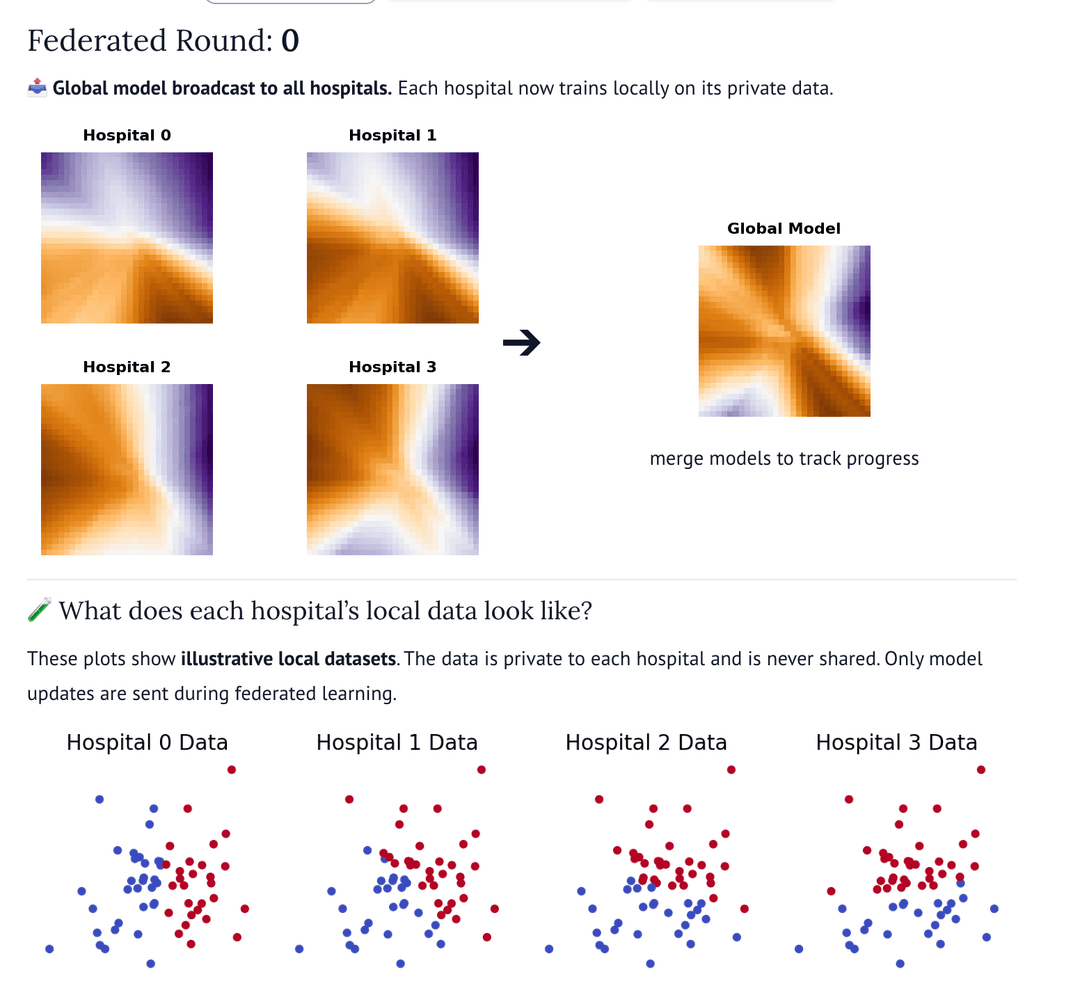
Interactive simulation of federated learning with hospitals training local models and FedAvg aggregation.
by N283T
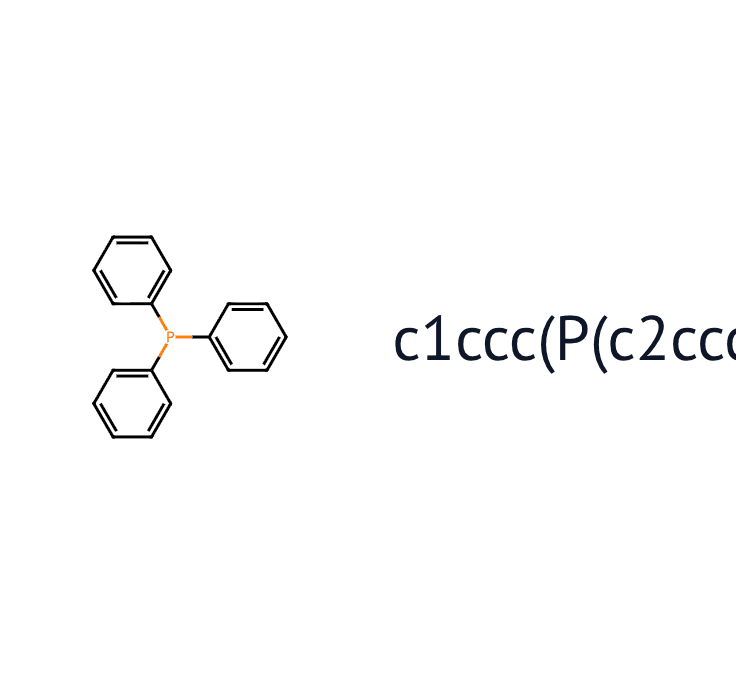
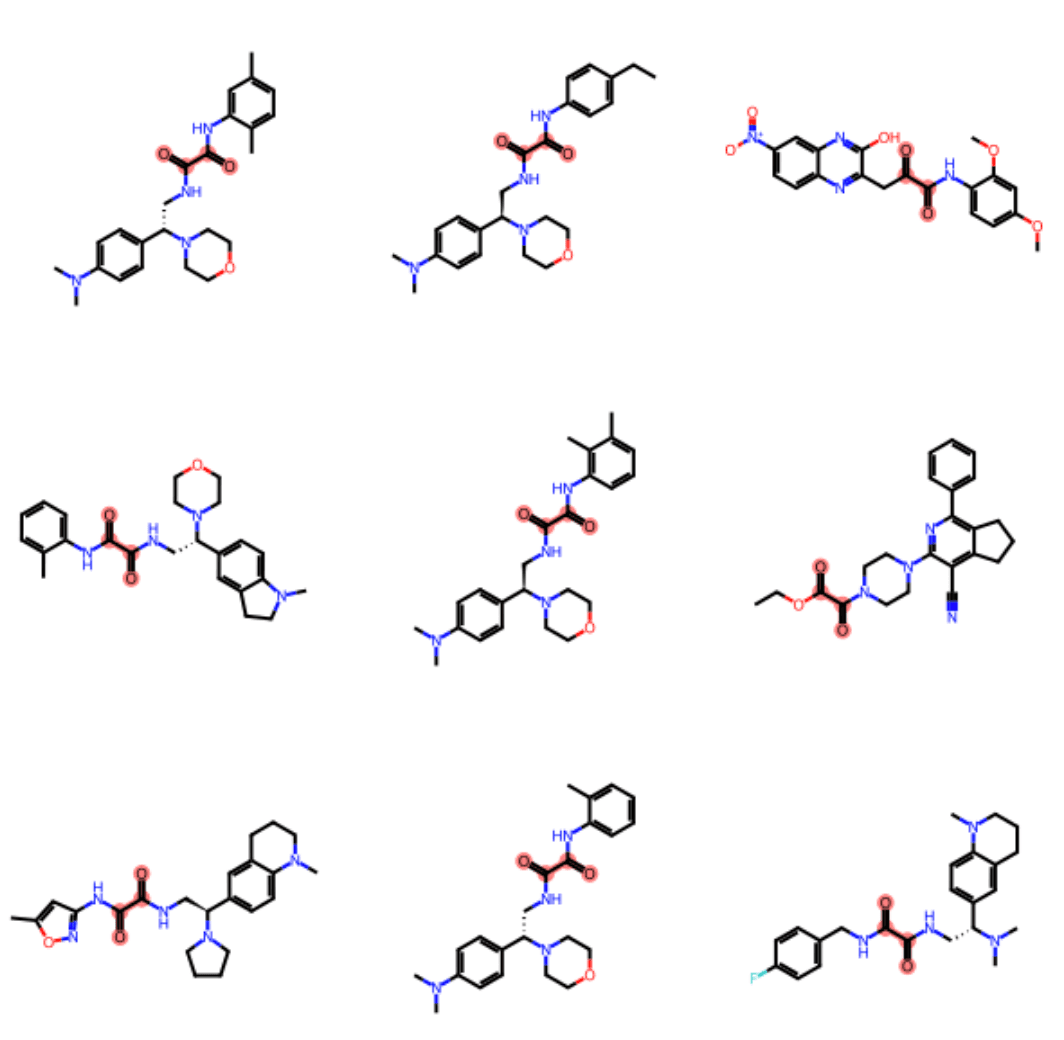
Visualize molecular chemical space using t-SNE and HDBSCAN clustering.
by Pat Walters
Explore Butina clusters of aligned chemical structures with an interactive cluster viewer.
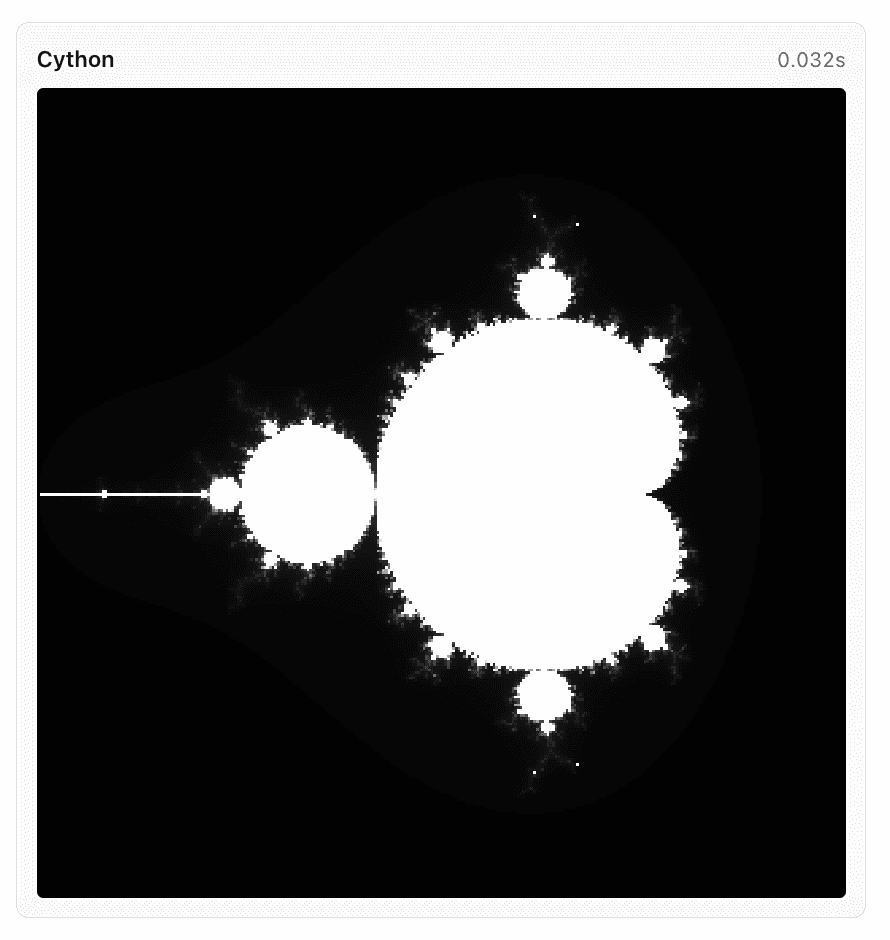
Mandelbrot set computation that uses the marimo-cython plugin for speedup.
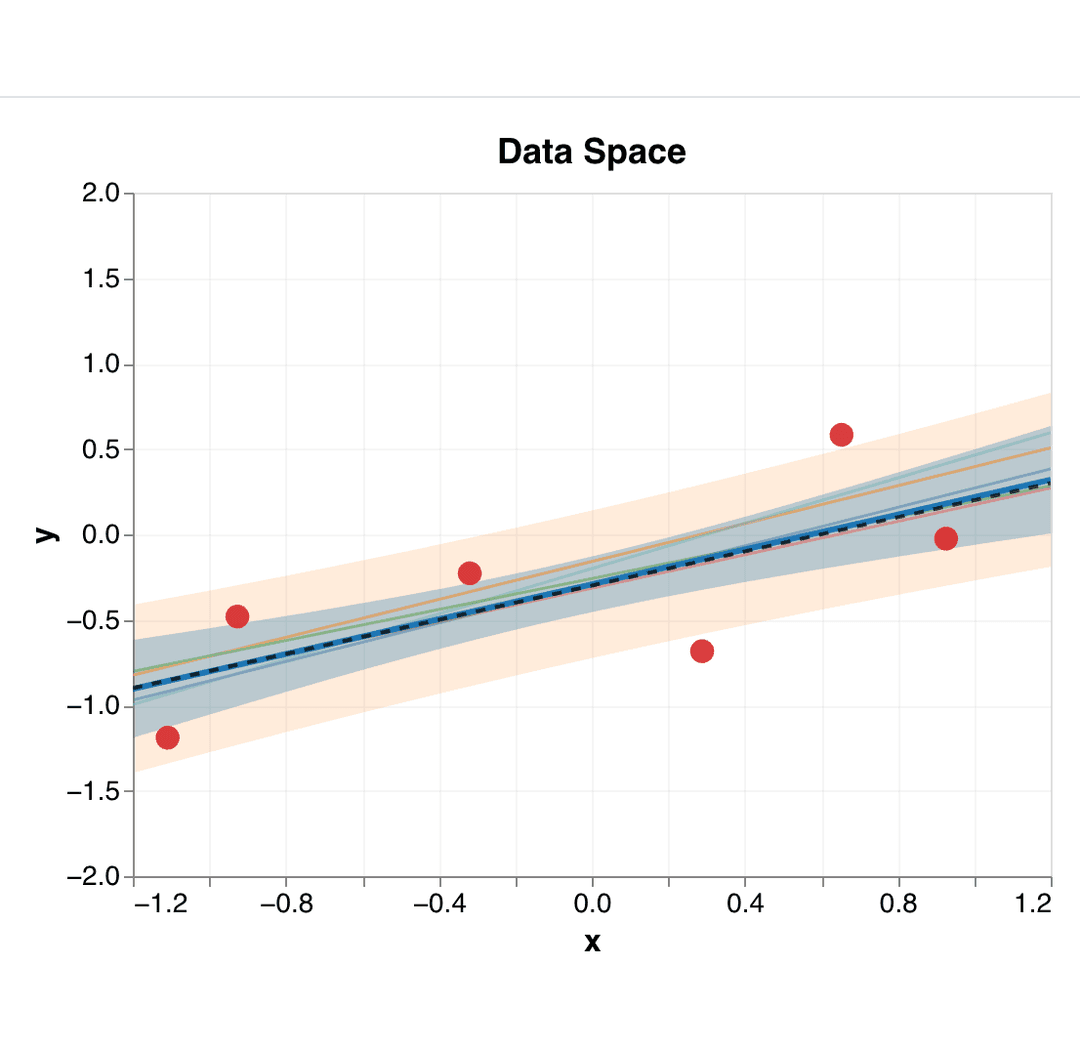
Interactive Bayesian linear regression showing how posterior distributions evolve as data points are added.
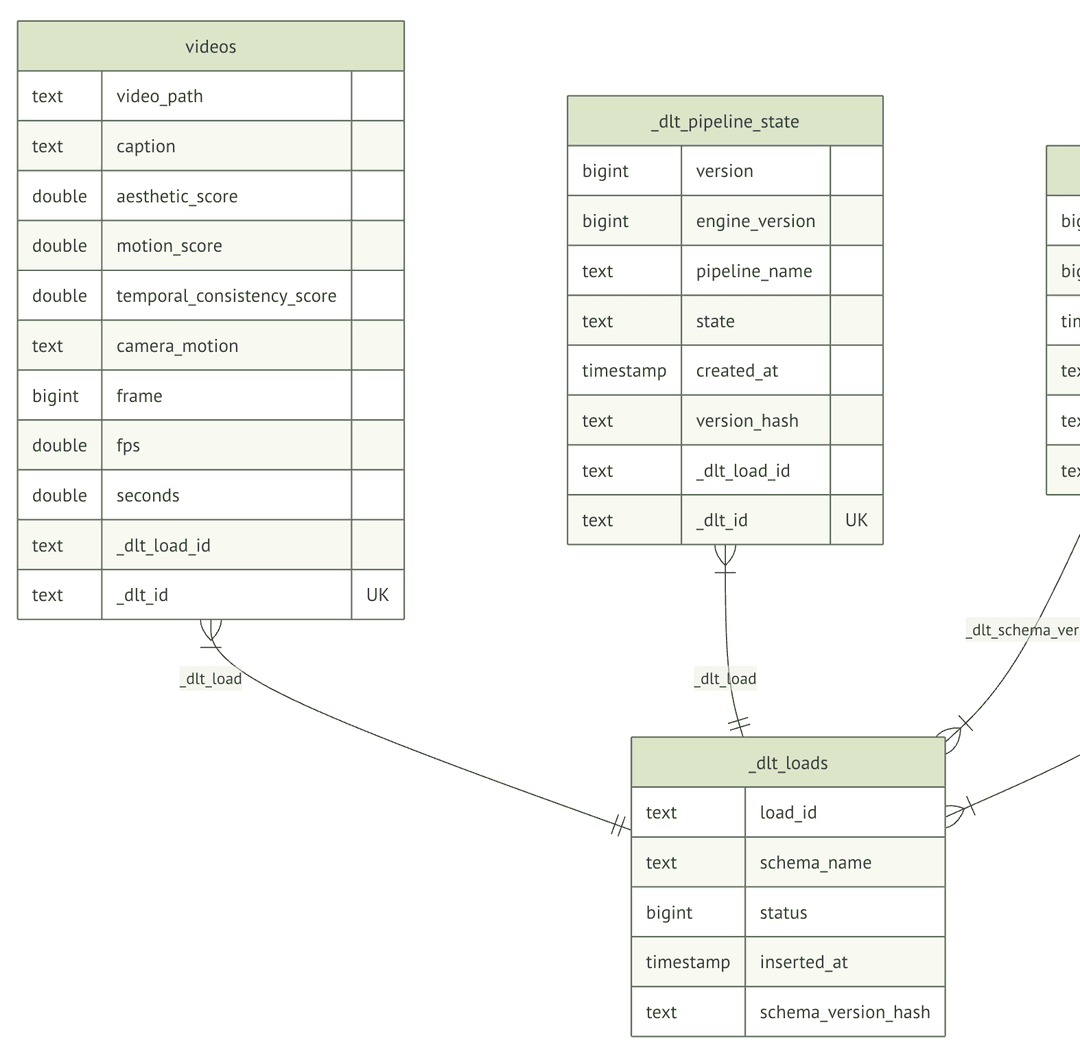
by dltHub
Load, validate, filter, and publish ML datasets using dlt pipelines with Hugging Face and LanceDB.
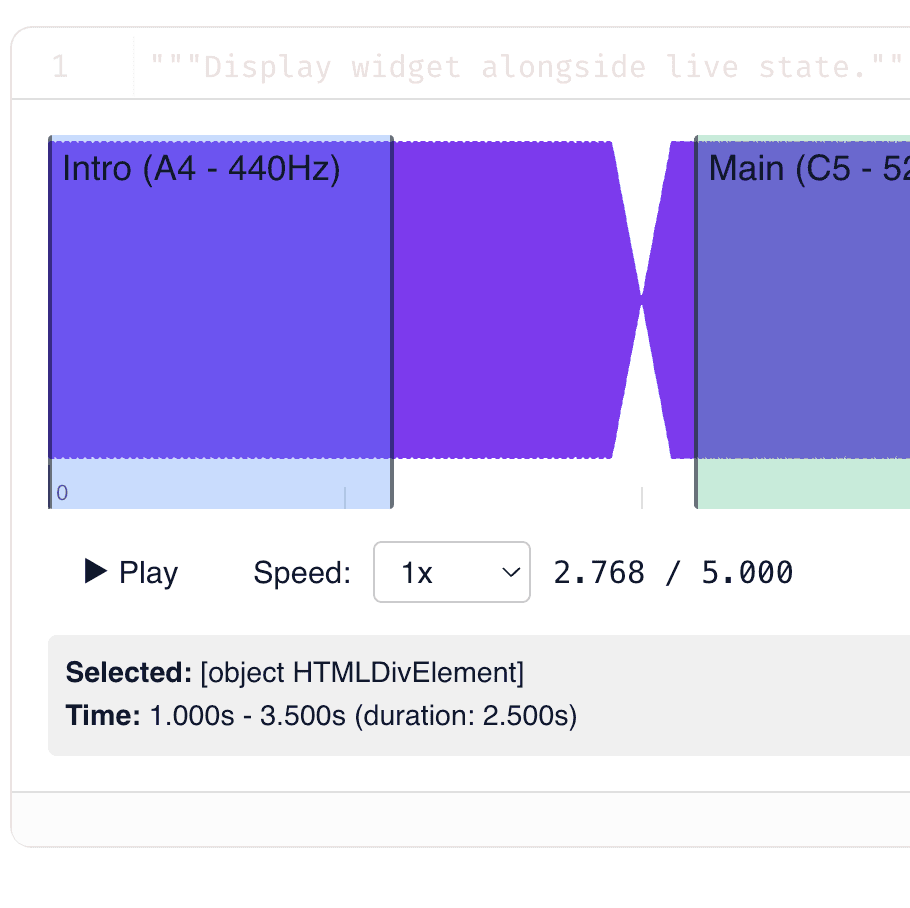
by Joseph Berry
Custom audio widget for annotation using anywidget and wavesurfer.js.
by Scott Lemke
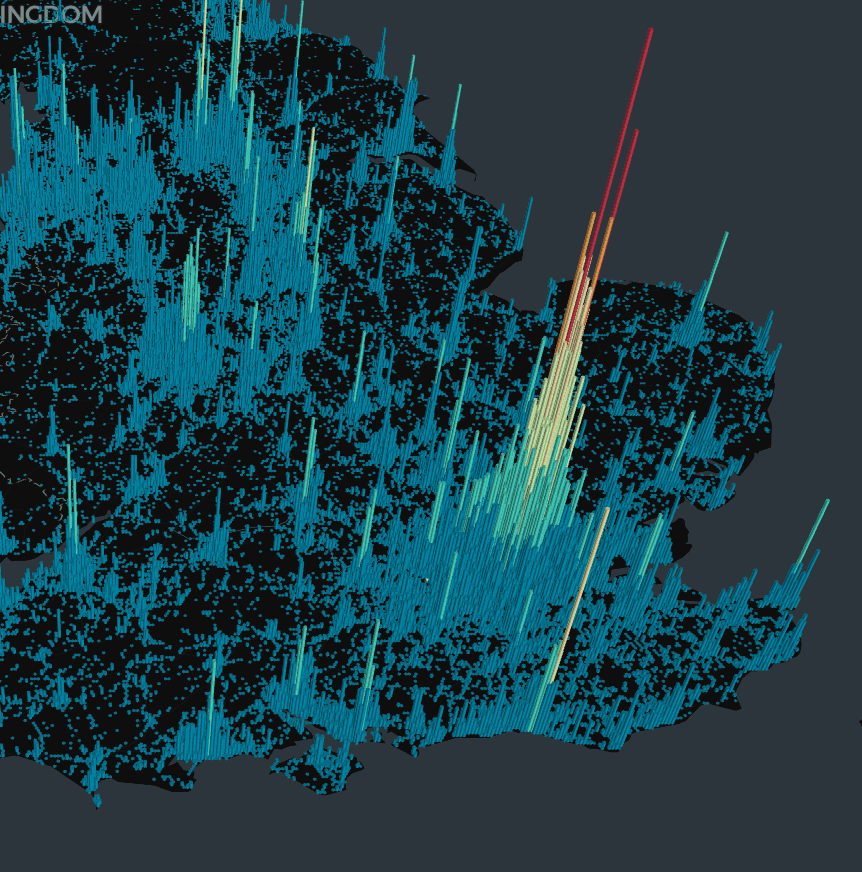
Interactive 3D hexagonal heatmap on a map with adjustable radius, coverage, and elevation.
by Liron Shani
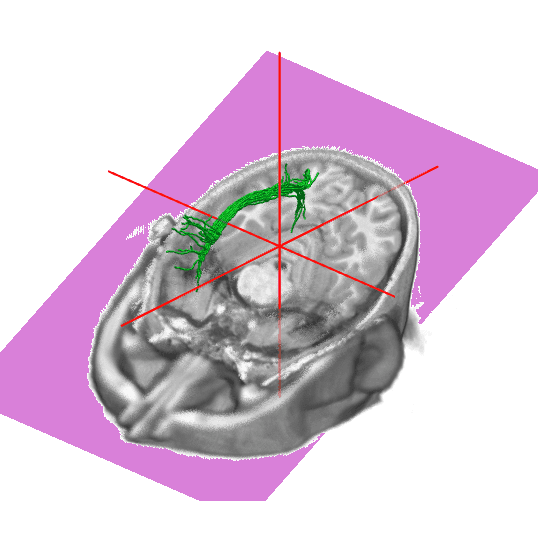
Visualization of diffusion MRI tractography, with a widget to explore slices of a human brain by scrolling.

Predict carbohydrate-active enzyme families from protein embeddings using a random forest model with a neural network.
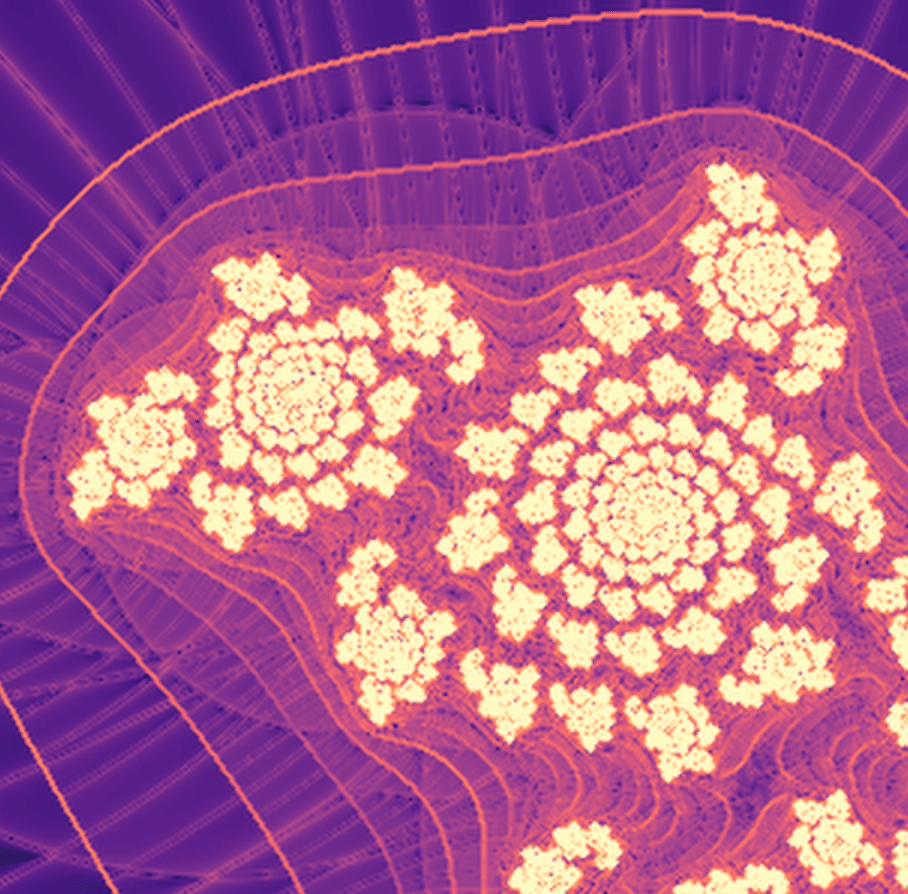
Visualize Julia sets of the map z² + c using discrete Lagrangian descriptors, with interactive parameters and animation.
by Mihai Nica
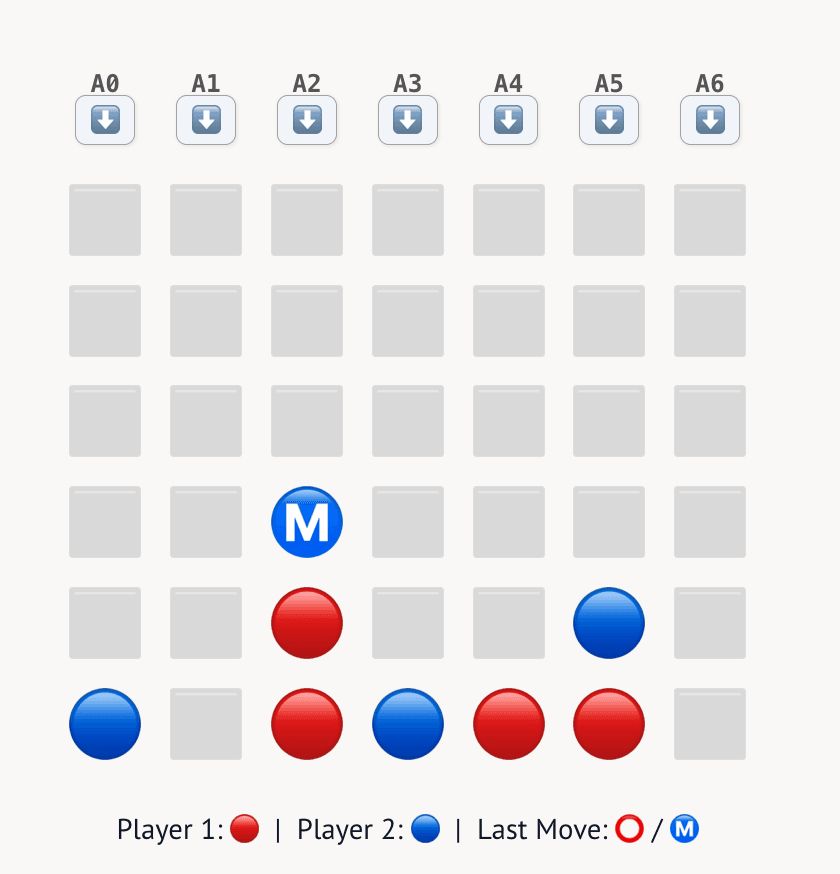
Explore Monte Carlo Tree Search step by step and play Connect 4 against an MCTS-powered bot.
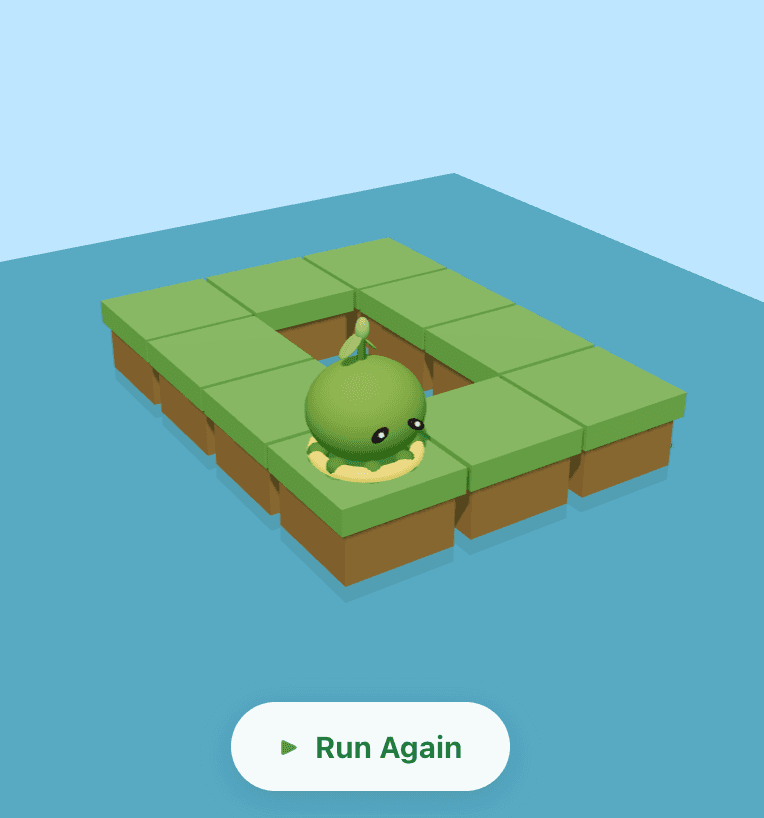
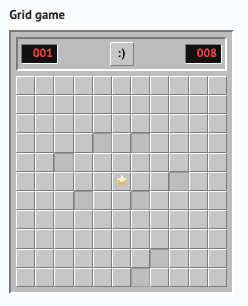
An interactive coding playground: guide Mo the Mossball through puzzle worlds by writing Python.
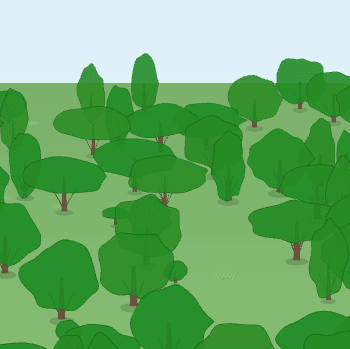
Explore tree-based ML ensembles as an interactive 2.5D isometric forest — trace predictions, drill into trees, sort by purity.
How language models represent statistics like mean and variance on curved activation manifolds, with steering experiments extended to geographic data.
by Eric Ma
An interactive explainer of 'Back to Basics: Let Denoising Generative Models Denoise', showing diffusion models can predict clean images directly since natural images live on a low-dimensional manifold.