Introducing marimo-lens

Explore your notebook with your agent, see how its results fit together, and decide what to investigate next.

Your agent is good at editing a marimo notebook, but it doesn’t see it the way you do. You’re looking at charts and tables, while it’s looking at dozens of code cells. So when you want to recolor a single bar, you can’t just say “make this orange”. You end up writing a paragraph explaining to your agent which cell, which chart and which bar you mean.
Not anymore! Today, we’re introducing marimo-lens, a widget that lets you point at any output and just ask. Lens makes sure your agent has all the context it needs to understand what you mean. And it works both ways: your agent can point back, too.
To try it, follow our getting started guide to connect your agent, and add Lens to your project:
uv add marimo-lens#Point and ask
Mark a point or a region on any output and type a note. Your agent gets your mark, your note, and exactly where that output sits in marimo’s dataflow graph: the cell that produced it and the cells it depends on.
This lets you guide and steer your agent just by pointing. But sometimes you’ll want to be guided yourself, through a complex notebook and its findings, especially when an agent generated most of the analysis.
#Let it walk you through its work
With Lens, your agent can read the notes you leave in the notebook, and it can also show you where to look. Ask it to walk you through an analysis, and it takes you from one output to the next with a short explanation at each step. You move on when you’re ready.
#Try it here
Press Show a walkthrough and step through the below outputs yourself.
This in-browser example is proudly powered by mdx-marimo, introduced as part of our previous launch week.
#Under the hood
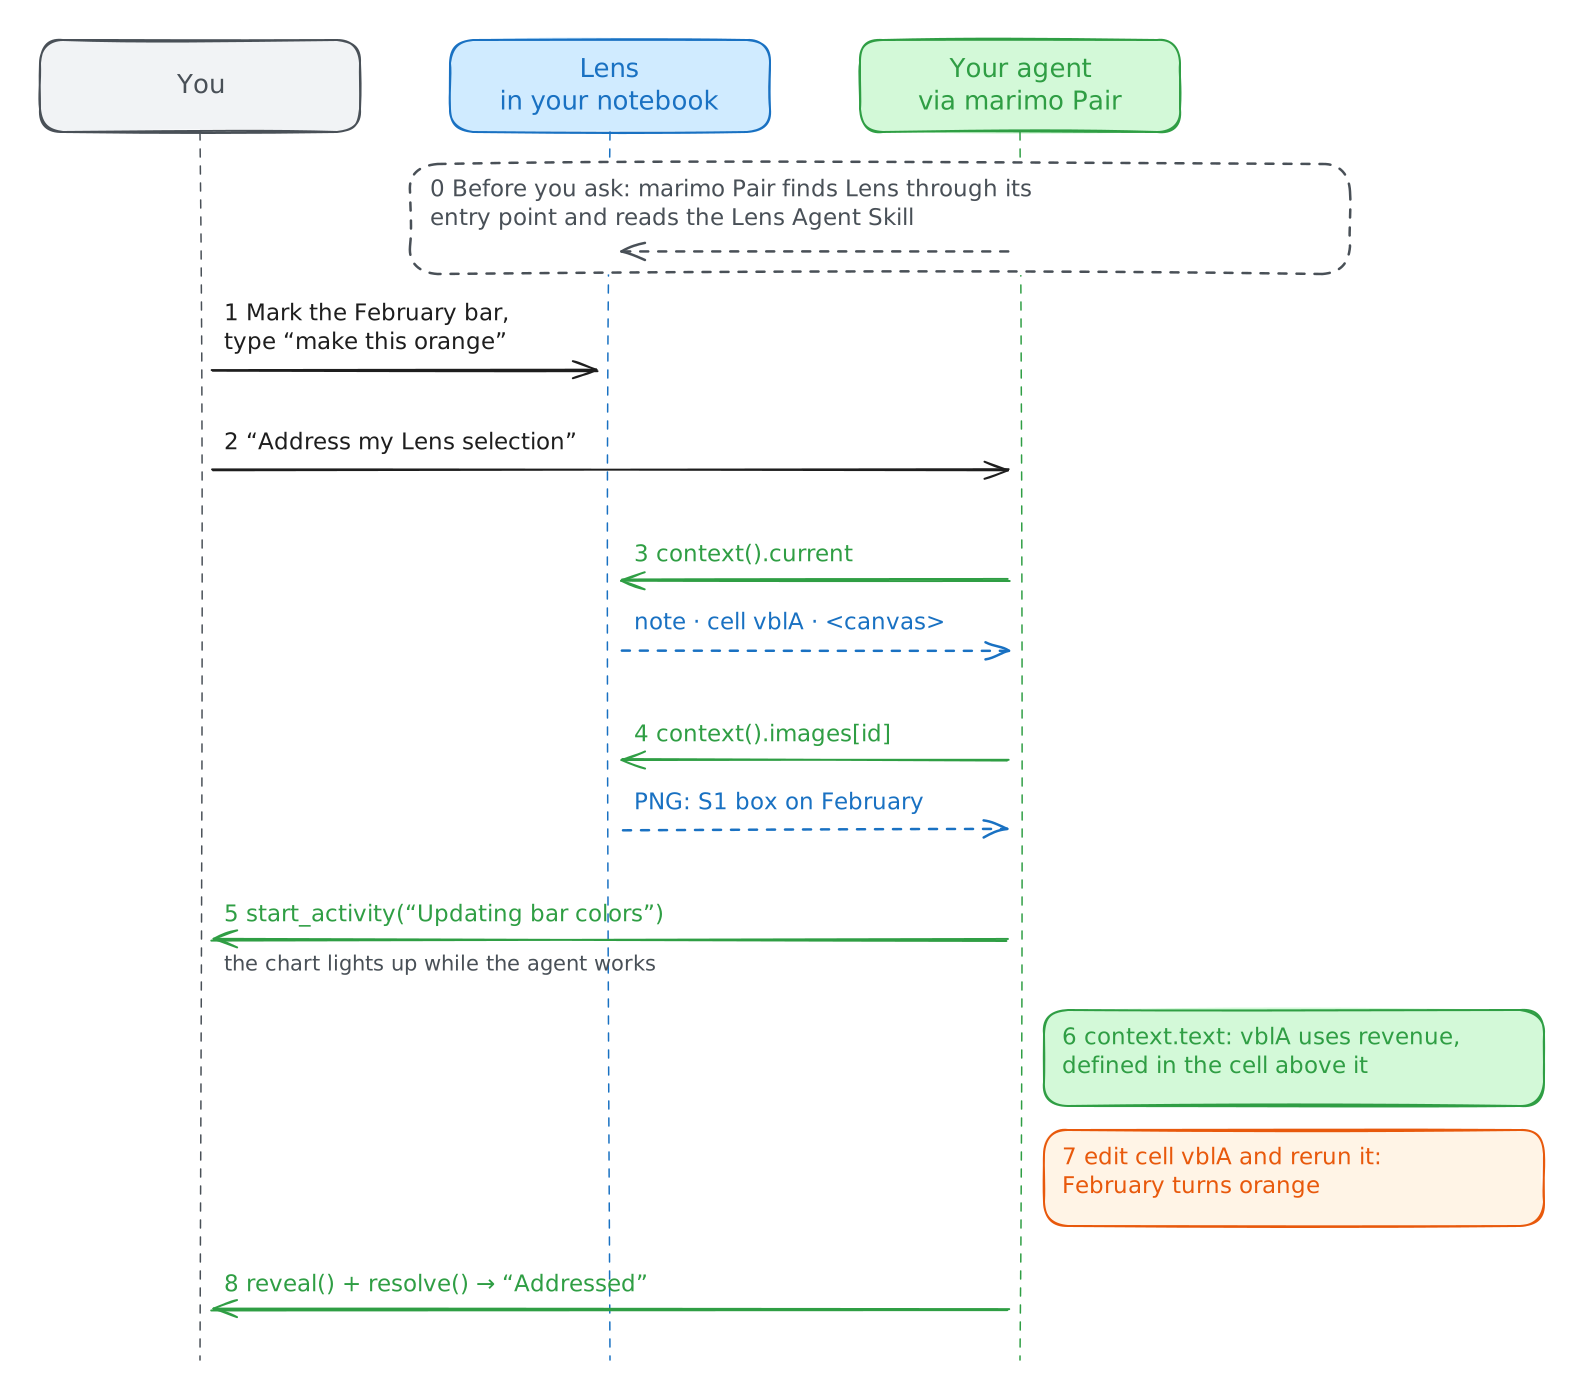
Let’s follow the “make this orange” request from the moment you mark the bar to the moment it turns orange. Three pieces work together: the Lens widget in your notebook, your agent connected through marimo Pair, and a skill that teaches the agent how to use Lens.
Lens is an anywidget, so it has two halves. Its frontend runs in your browser and sees what’s on screen: your pointer, the rendered chart, the pixels. Its Python half runs in the notebook’s kernel next to your code and data. The two stay in sync, so what you mark in the browser is what the agent reads in Python.
#Before you ask
marimo Pair connects your agent to the running notebook, so it can execute code
in the notebook’s kernel. Lens registers itself with marimo through a Python
entry point,
which is how the agent learns that Lens is there. The marimo-lens package also
ships an Agent Skill, where Lens introduces
itself: what it’s for, when to use it, and which functions the agent can call.
The skill ships inside the package, so its instructions always match the
version you installed.
#You point
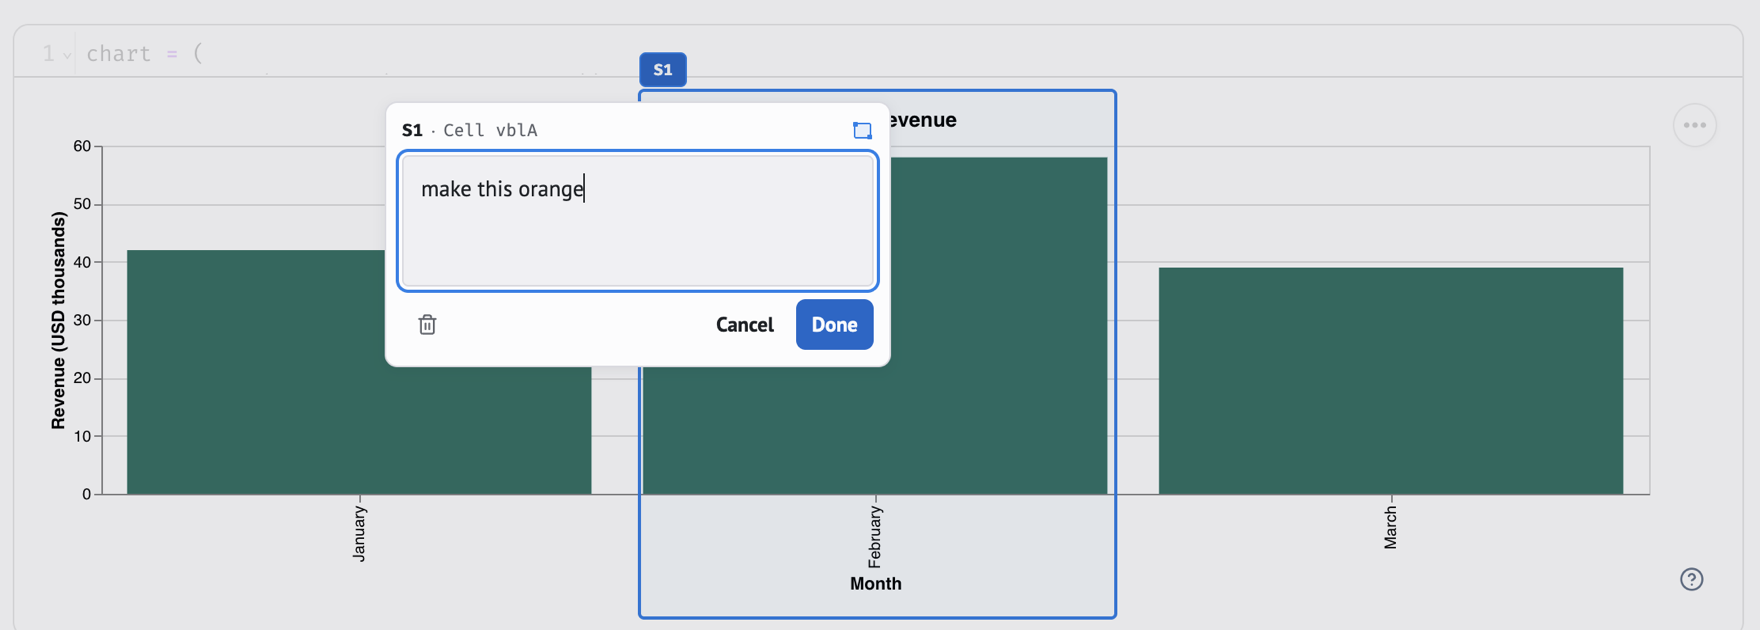
You draw a box over the February bar and type your note. Then you tell your agent: “Address my Lens selection.”
#The agent reads your selection
The agent calls lens.context().current and gets back your selection:
{
  "label": "S1",
  "note": "make this orange",
  "target": { "kind": "notebook", "cellIds": ["vblA"] },
  "cells": [{ "id": "vblA", "status": "available" }],
  "anchor": {
    "kind": "rect",
    "x": 0.36, "y": 0.02, "width": 0.28, "height": 0.95
  },
  "snapshot": { "status": "available" },
  "domHint": { "tag": "canvas", "path": "::shadow > div > … > canvas" }
}
It now knows your note, that cell vblA produced the chart, and where your box
sits, as fractions of the chart’s width and height. What it doesn’t know yet is
which bar you meant. The DOM hint says the chart is drawn on a <canvas>, so
there’s no element for “the February bar” to point to.
#It looks at what you saw
So the agent reads the image Lens captured when you made the selection:
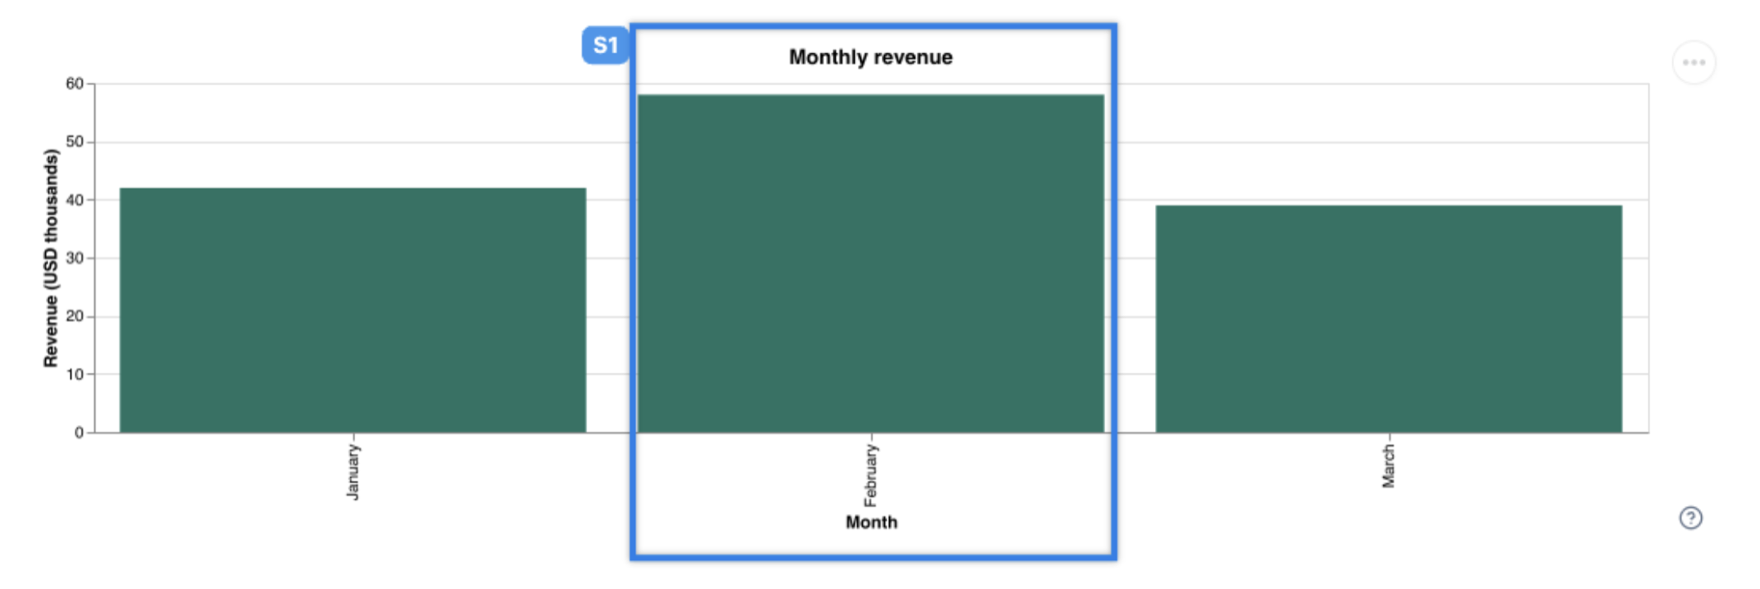
lens.context().images[selection["id"]] # b'\x89PNG\r\n\x1a\n...'Lens’s frontend renders the chart to a PNG and draws your S1 box on
top. An agent that can read images sees the box sitting on February.
#It shows you it’s on it
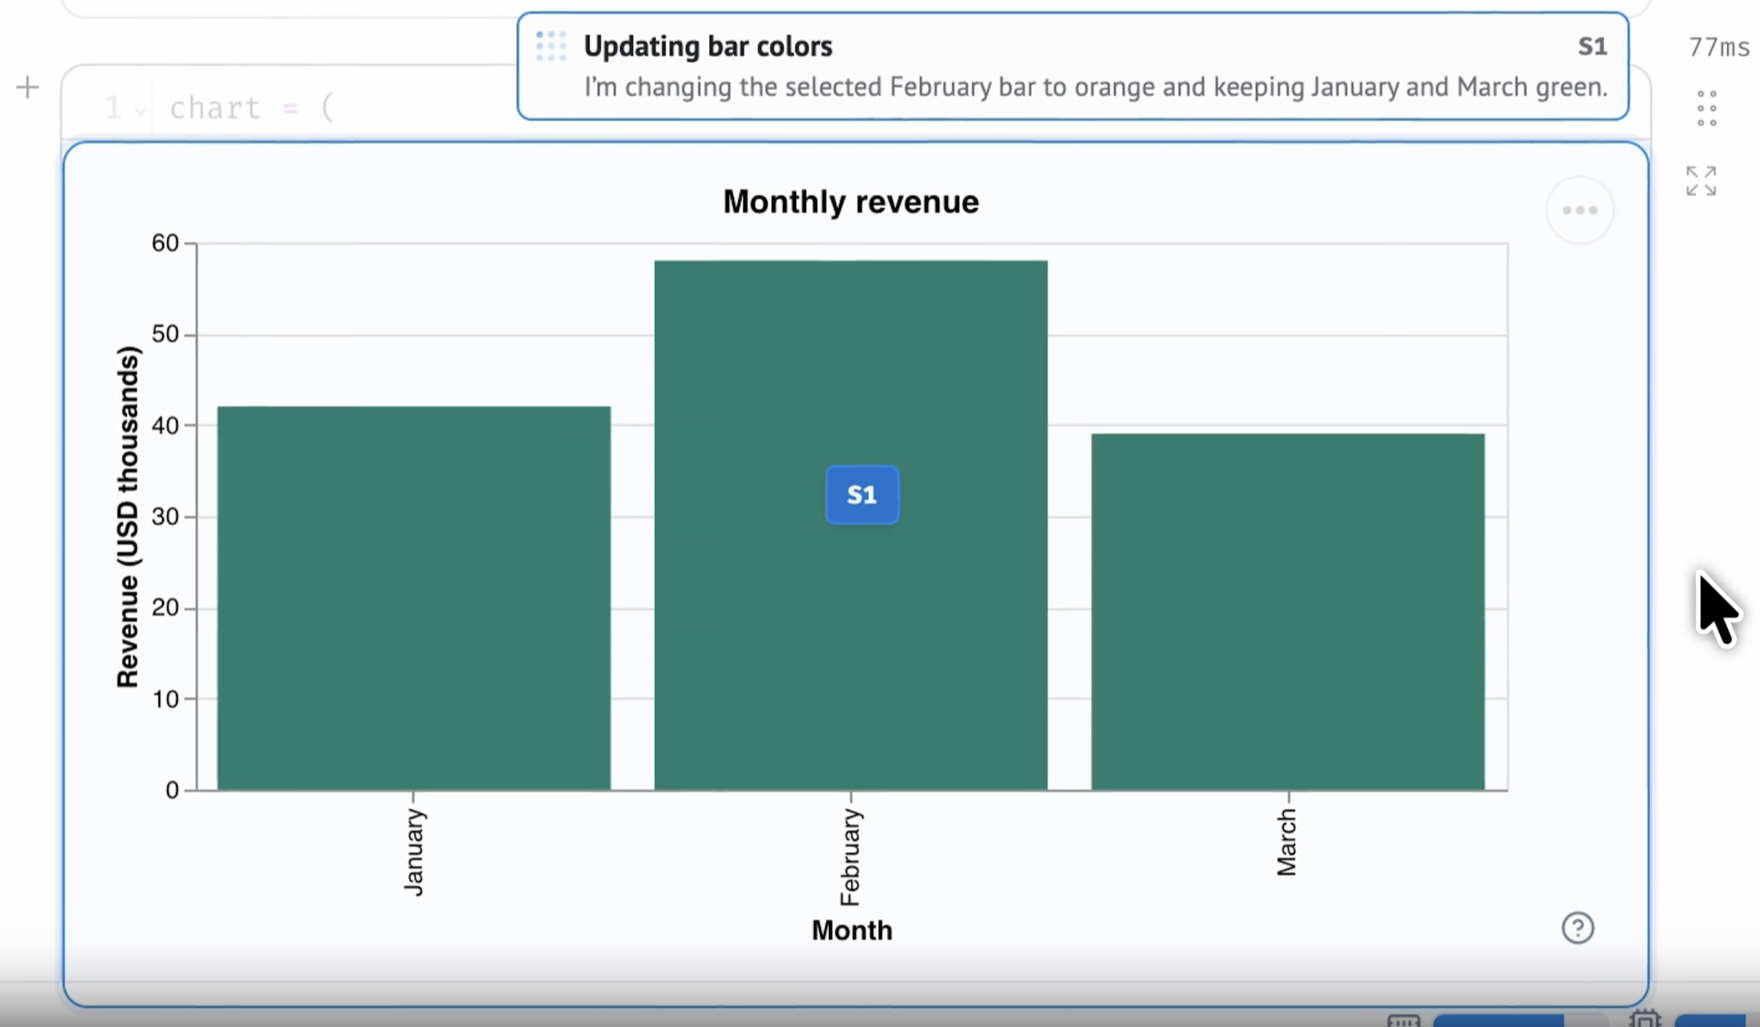
Before touching any code, the agent calls start_activity(). Lens highlights
the chart with a short message, so you know the request landed and what the
agent is about to do.
#It follows the data
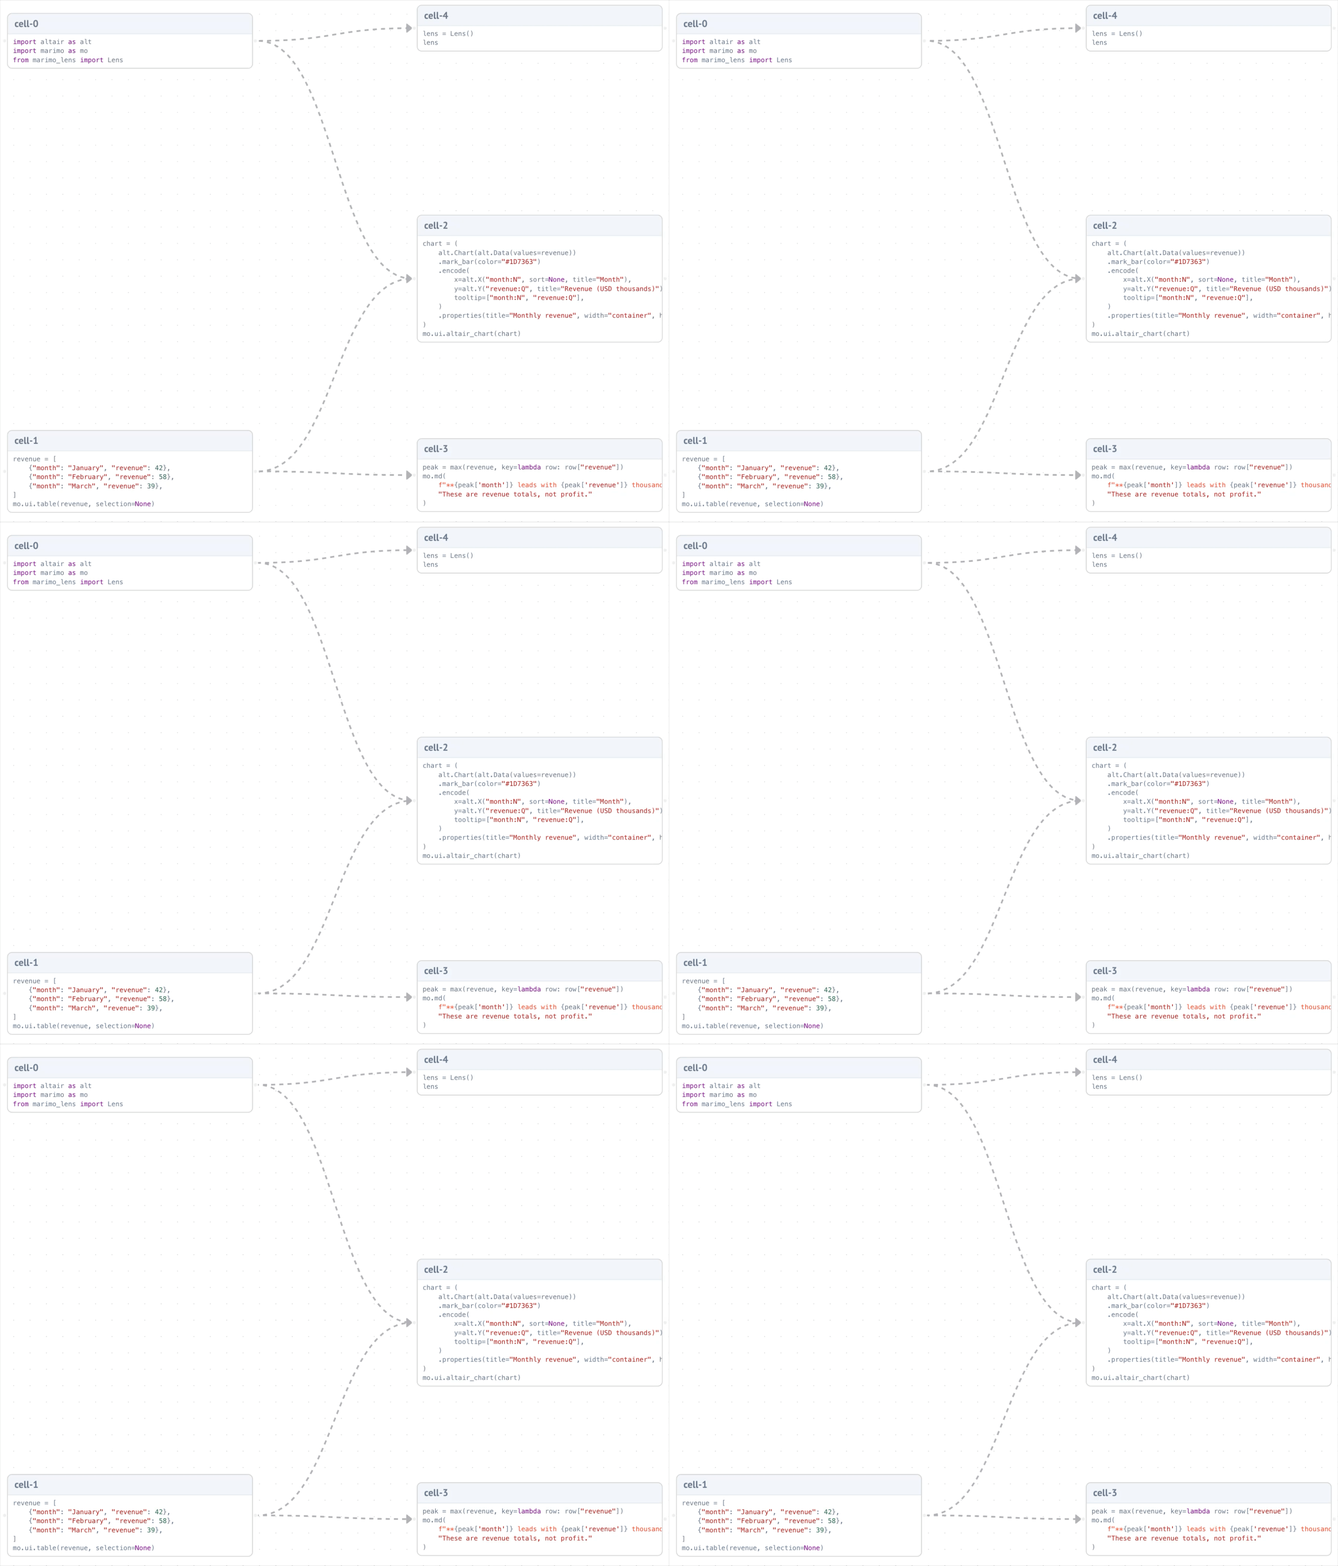
The chart cell starts with alt.Chart(alt.Data(values=revenue)), but revenue
isn’t defined there. marimo knows where it comes from, because a notebook is a
dataflow graph. The
chart cell depends on the imports and on the cell that defines revenue:
Lens walks that graph and puts the relevant cells into lens.context().text,
upstream cells first:
### Cell `MJUe` (upstream)
- Defines: `revenue`
revenue = [
    {"month": "January", "revenue": 42},
    {"month": "February", "revenue": 58},
    {"month": "March", "revenue": 39},
]

### Cell `vblA` (producer)
- Defines: `chart`
- References: `alt`, `mo`, `revenue`
- Upstream IDs: `Hbol`, `MJUe`
chart = alt.Chart(alt.Data(values=revenue)).mark_bar(color="#1D7363")...
Now the agent knows the shape of the data and that month drives the x-axis.
That’s enough to change exactly one thing in vblA, a conditional color for
the February bar, and rerun the cell. Lens keeps this context small. It
includes at most 64 cells within 24,000 characters of source, tells the agent
what it left out, and redacts passwords and file uploads.
#It hands the result back
When the bar is orange, the agent calls reveal() to bring the chart into view
and resolve() to move your selection into History with a short summary of
what it changed. Both calls carry the context revision the agent read. If you
had moved your box or edited your note in the meantime, the call would fail and
the agent would read your latest request first.
Lens never edits or runs cells itself. That’s the agent’s job, through marimo Pair. Lens owns attention: what you pointed at, and what your agent wants you to look at.
For the full design and a worked analysis, read our paper, Point, Revise, Review, and the Lens docs. We’ll present Lens to the scientific community at the Agentic VIS Workshop at IEEE VIS in Boston this November.
We’re looking forward to seeing how the community uses Lens in their own notebooks. If something breaks or you have an idea, please open an issue, and follow the releases to see what’s coming next.