Movies Dashboard
by marimo team
Explore movie data interactively with a dashboard constructed with marimo UI elements.
About this notebook
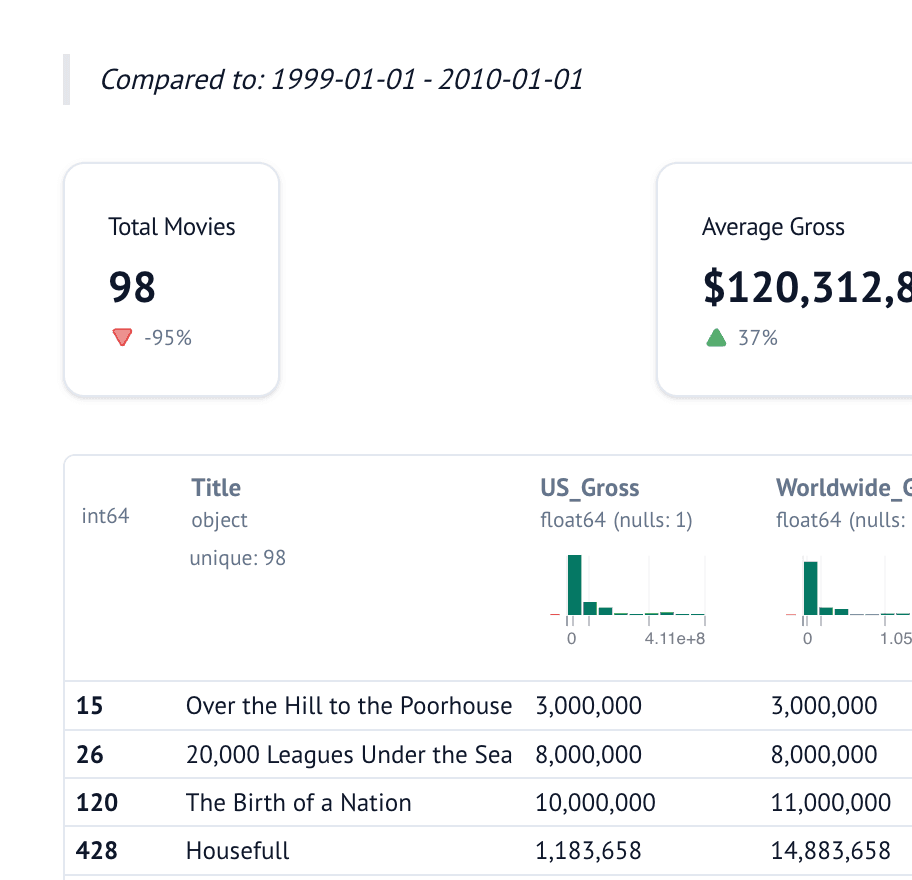
This notebook shows a dashboard for the movies dataset from vega-datasets, filtered with pandas and plotted with Altair. A row of marimo stat tiles reports the movie count and the average gross, budget, runtime, and rating for the selected date range. Each tile compares its value to the previous period of the same length and shows the change as a percentage.
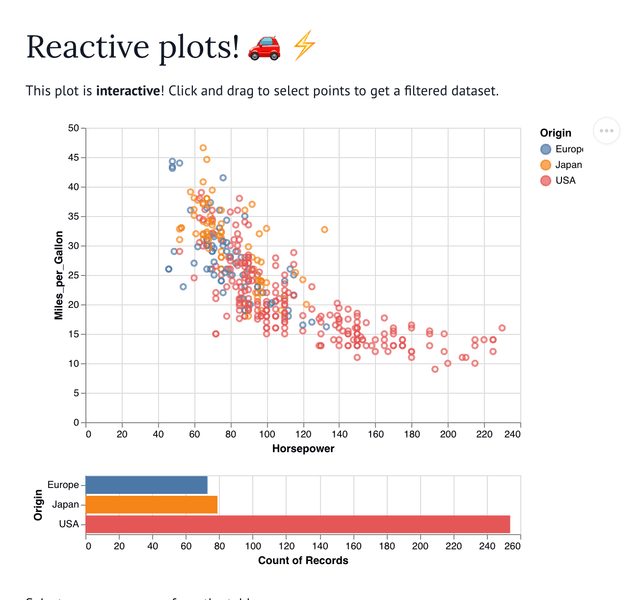
Two date pickers set the start and the end of the range. Four buttons select a whole decade, from the 1980s to the 2010s. When the range changes, marimo re-runs every cell that depends on it. The stat tiles, a data table, a scatter plot, and a bar chart of genre counts all update. The scatter plot places each movie by production budget and IMDB rating, colored by genre. It is also a selection widget: select points with your mouse, and a second row of stat tiles reports the same statistics for the selection alone.
The notebook stores the date range in marimo state. The date pickers and the decade buttons share the same getter and setter pair, so a decade button also updates both pickers. The comparison period is a window of equal length directly before the selected range.