SQL interpolation
by marimo team
A demo of how to use marimo UI and f-strings to interpolate SQL queries.
About this notebook
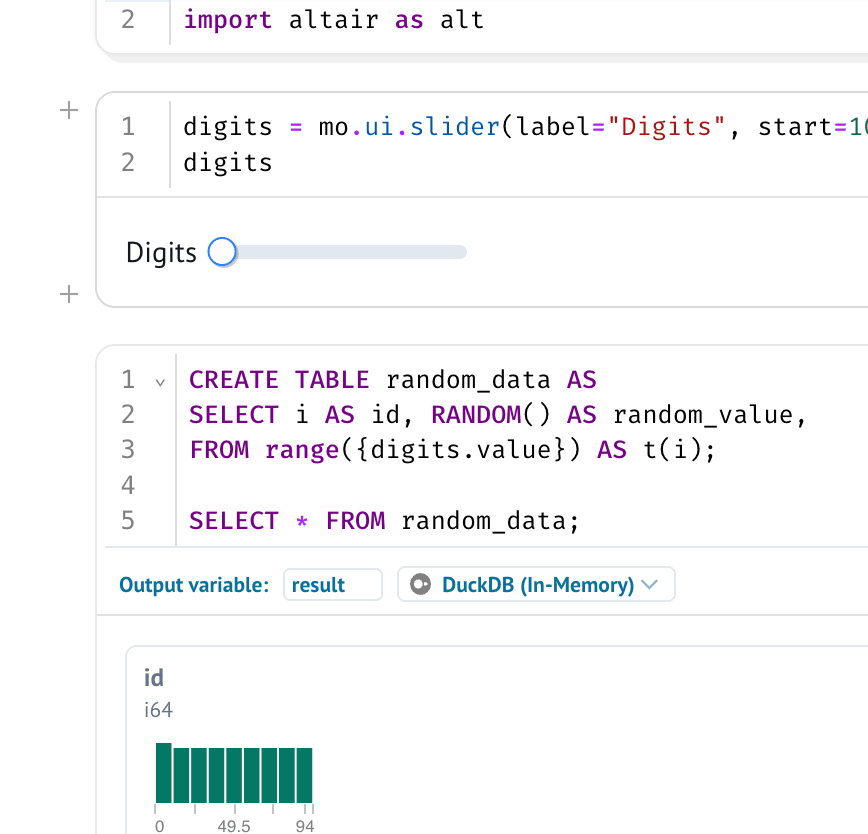
This notebook builds a synthetic dataset with DuckDB and shows it as a histogram. It does not load an external file. Instead, a SQL query creates a table called random_data. The query uses DuckDB RANDOM() to give each row a value between 0 and 1. The notebook depends on marimo with its SQL extra, DuckDB, Polars, and Altair.
The reader controls one slider labeled Digits. The slider runs from 100 to 10000 in steps of 200. The slider value sets the row count in the SQL range() call. marimo interpolates that value into the query string with a Python f-string. When the reader moves the slider, the query runs again and returns a new Polars table. The Altair bar chart then bins the random_value column and counts the rows per bin. So a larger slider value produces more rows and a flatter histogram.
The SQL cell returns its result as a Polars DataFrame, because the app sets sql_output to "polars". The chart calls the plot.bar helper on that Polars result. Note that the query runs CREATE TABLE each time, so a repeated run may fail if the table already exists.