About this notebook
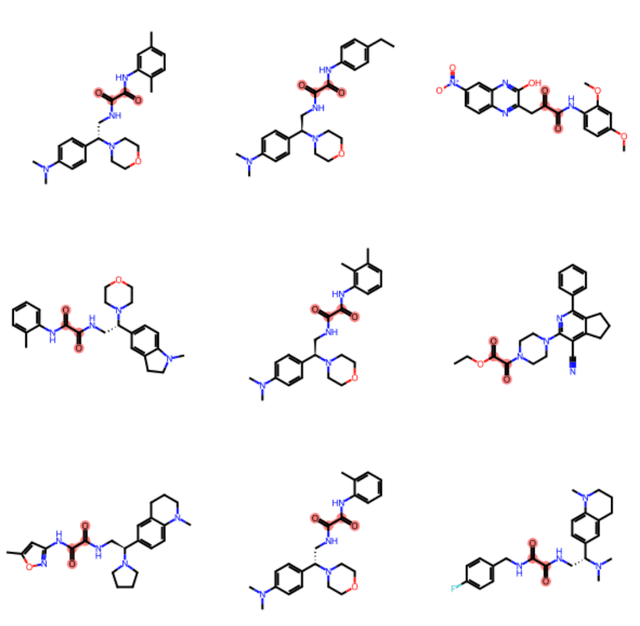
This notebook maps the chemical space of a set of molecules. It loads NCI sample molecules from the RDKit data file first_5K.smi. It uses RDKit, pandas, scikit-learn, and matplotlib. RDKit computes a Morgan fingerprint for each molecule. The code then builds a Tanimoto distance matrix between all molecules. A first table shows each molecule with its drawn structure and properties such as molecular weight and CLOGP.
You set the number of molecules, the Morgan radius, and the fingerprint size. scikit-learn reduces the distance matrix to two dimensions with t-SNE. HDBSCAN then groups the points into clusters. You control the t-SNE and HDBSCAN parameters through number inputs. A matplotlib scatter plot shows the clusters and marks noise points in gray. You select points with a box or lasso while you hold Shift and drag. A second table then shows the structures and descriptors for the molecules you selected.
The t-SNE step reads the precomputed distance matrix directly. It uses all CPU cores through the n_jobs setting. A progress bar reports progress while the code builds the distance matrix. A checkbox controls whether the table includes noise points, which HDBSCAN labels -1. If the current parameters find no clusters, the notebook shows a warning instead of a plot.