Bayesian Regression Demo
Interactive Bayesian linear regression showing how posterior distributions evolve as data points are added.
About this notebook
This notebook shows sequential Bayesian linear regression. It fits a straight line y = w0 + w1*x to two-dimensional points. The notebook does not read an external dataset. Instead it makes points from a true linear model that you set with sliders. It uses NumPy for the math and SciPy for the Gaussian distributions. It uses Altair for the data plot and Matplotlib for the weight plot. marimo provides the sliders, the buttons, and the clickable chart.
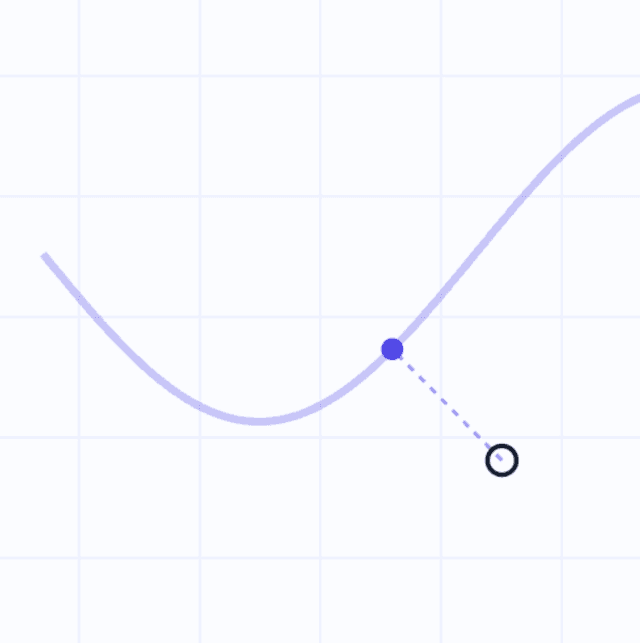
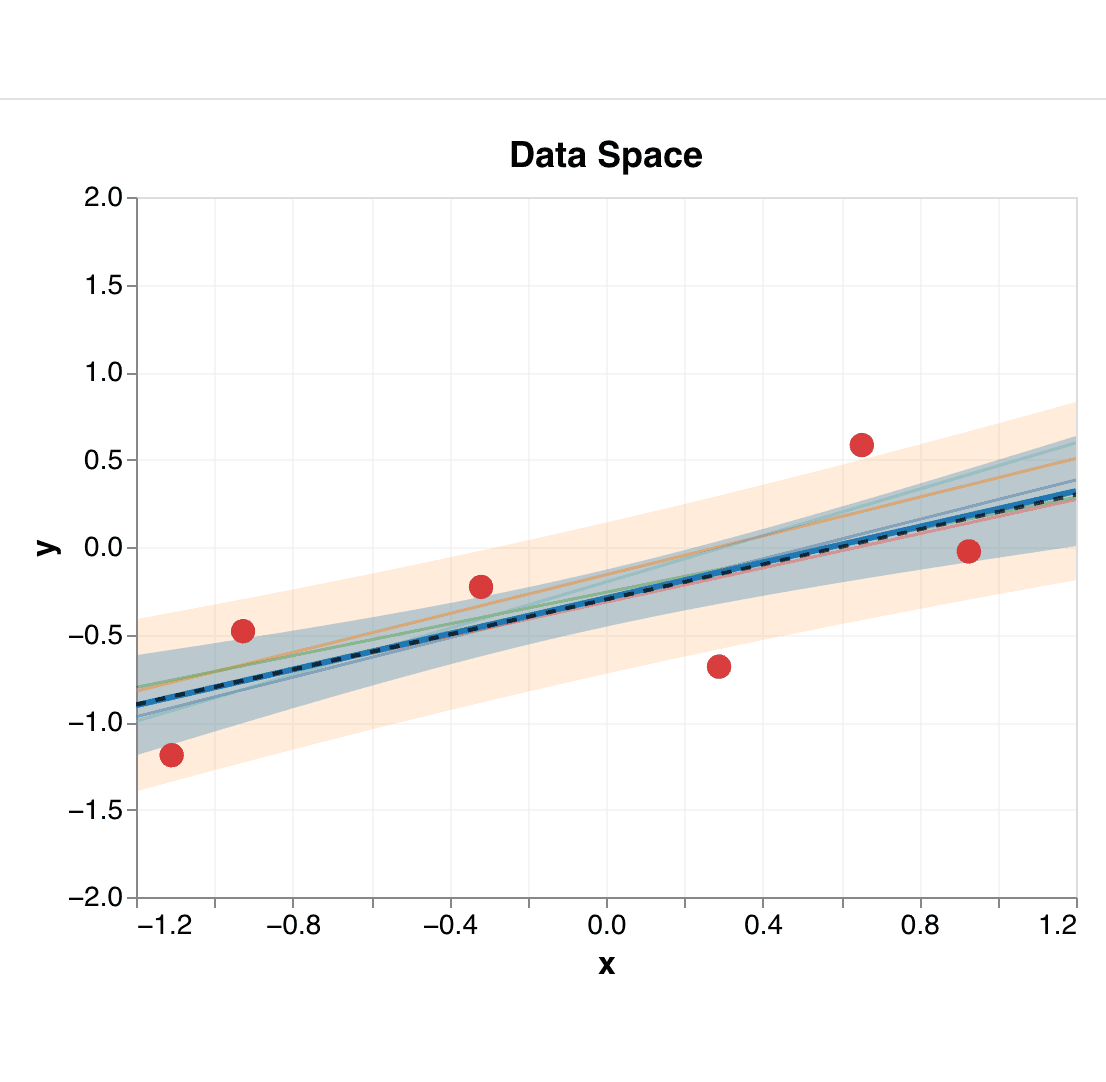
You control the model with sliders in a sidebar. You set the true slope and intercept, the prior precision, and the noise precision. You choose how many random points to draw and the random seed. You can also click the right plot to add your own points. Each new point updates the posterior right away. The left plot shows the posterior over the two weights. The right plot shows the mean line, the true line, and two uncertainty bands. One slider draws sample lines from the posterior.
The code computes the posterior mean and covariance in closed form. The design matrix uses the basis phi(x) = [1, x]. The right plot separates two kinds of uncertainty. The inner band shows epistemic uncertainty from the weights. The outer band adds the observation noise. A metrics table reports RMSE, MAE, CRPS, and log likelihood for the training points and a test grid.