dtour: Interactive Tours of High-Dimensional Data
Animate through 2D projections of high-dimensional data and link the selections to other views.
About this notebook
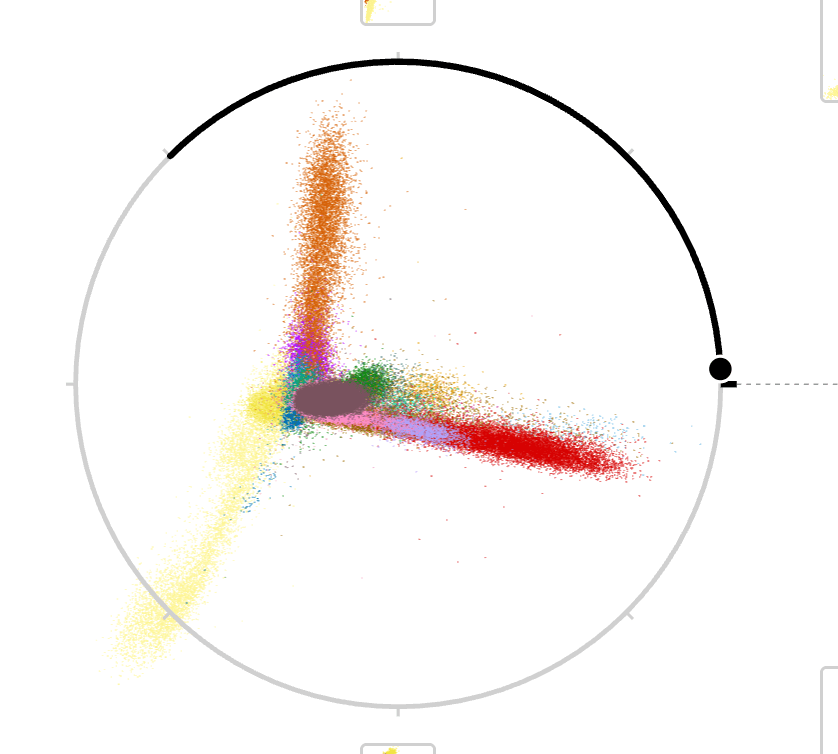
This notebook demonstrates dtour, a widget that explores high-dimensional data through animated tours. A tour moves through a sequence of 2D projections. You can play and rewind the tour, or drag the axes to set a projection by hand. The notebook uses dtour, polars, jupyter-scatter, and matplotlib, and it loads precomputed UMAP embeddings from data.dtour.dev.
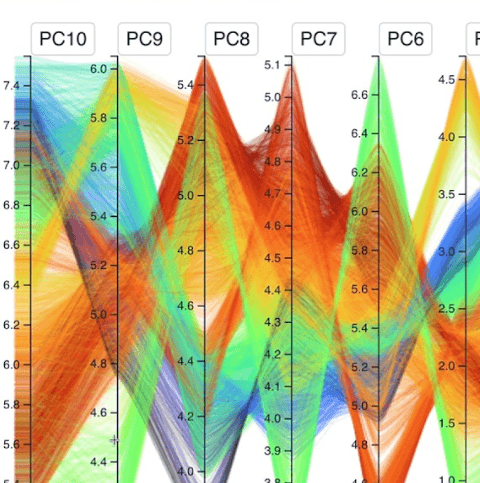
The first example tours the first eight principal components of 276K cells from the La Manno et al. 2021 mouse brain atlas. A jupyter-scatter UMAP plot of the same cells is next to the tour, and the two views share one selection. Click a class in the legend or draw a lasso in one of the views, and a table shows the subclasses that the selected cells are enriched for.
The second example tours an 8D UMAP of 346K tumor immune cells from the Mair et al. 2022 CyTOF dataset. Bars around the tour show the confusion of the phenotypes in each keyframe, and the cev-metrics package calculates these values in the notebook. The third example links a tour of the scikit-learn digits pixels to a UMAP view with dtour.link. A custom anywidget shows the selected digit images, and a matrix shows which digits their 10 nearest neighbors are.