Spectral Decomposition
by marimo team
Interactively explore a spectral decomposition with matrix widgets
About this notebook
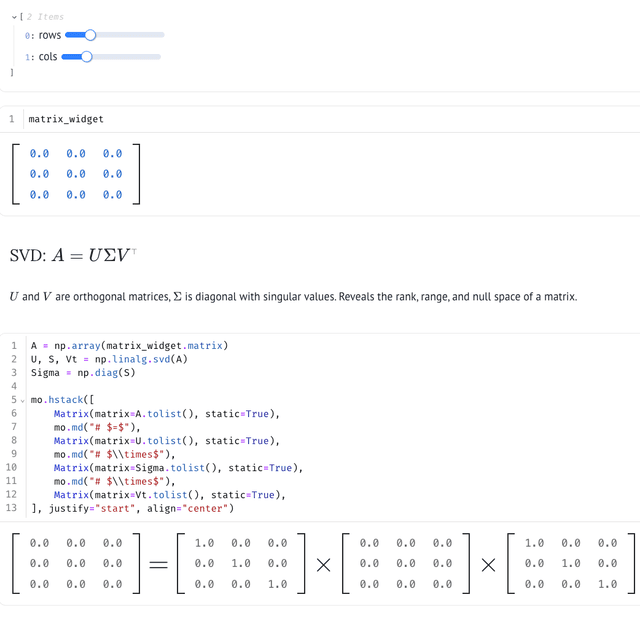
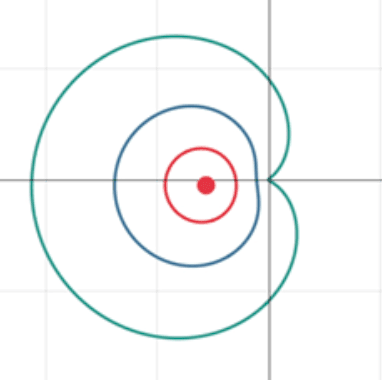
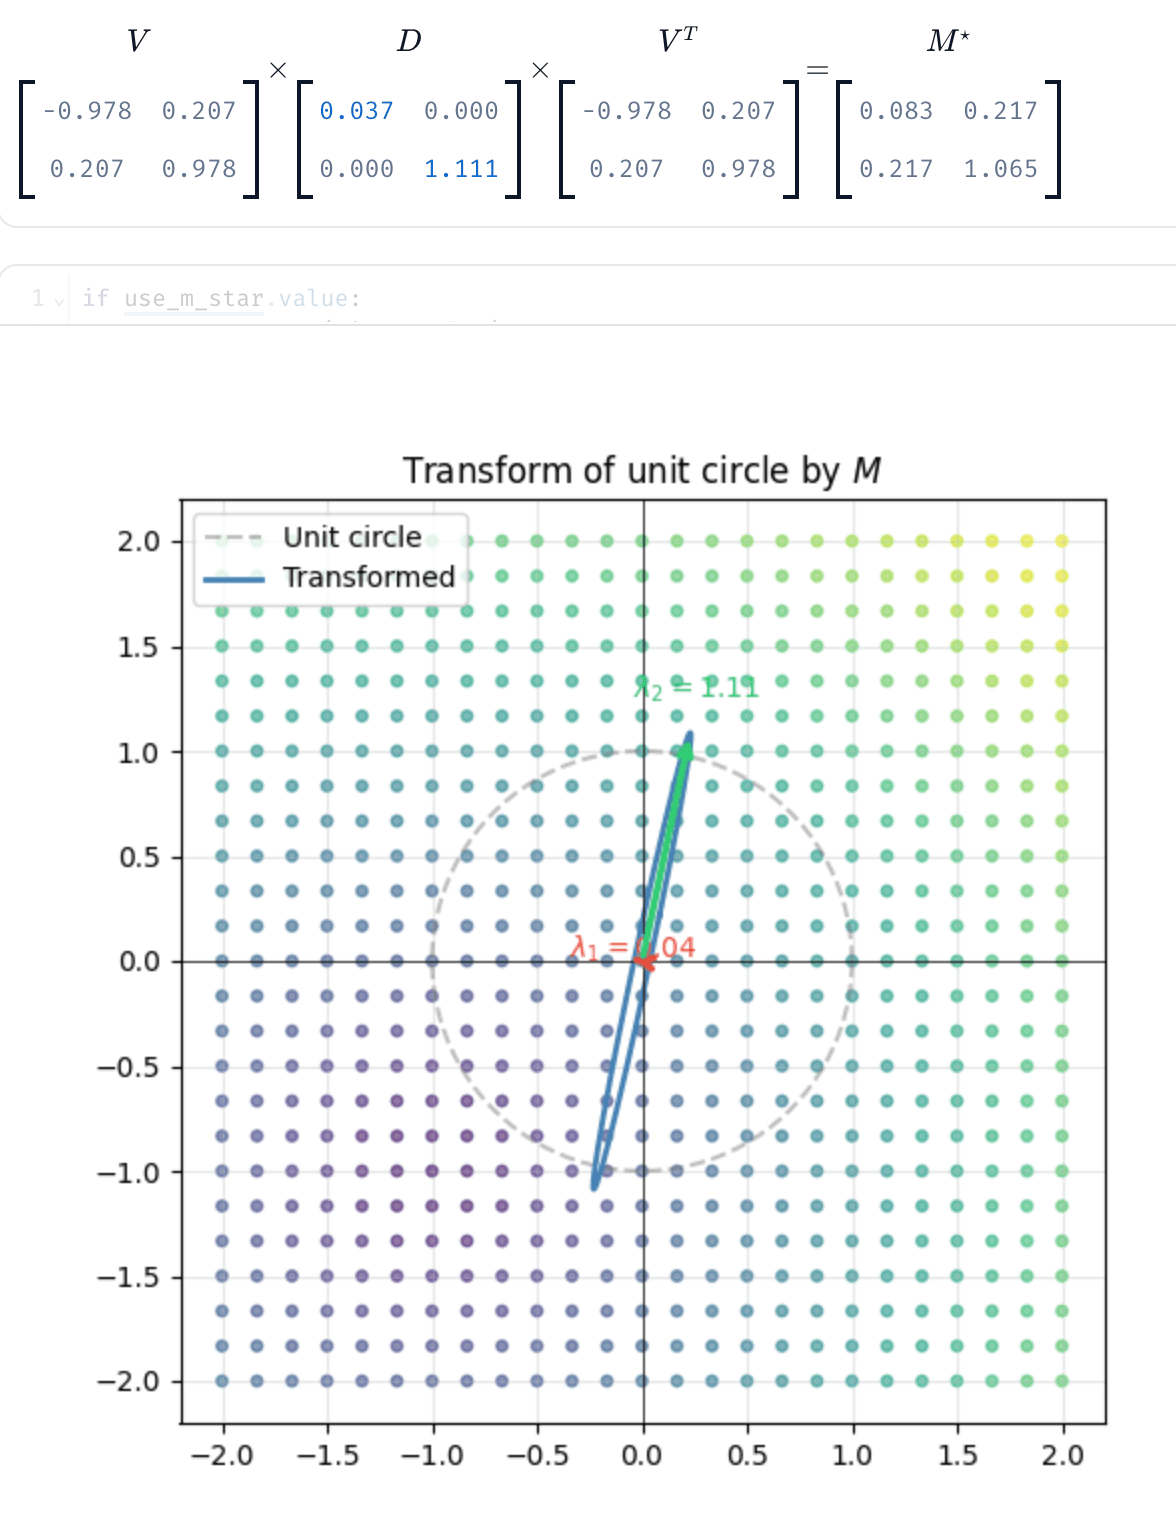
This notebook illustrates the spectral decomposition of a symmetric 2x2 matrix with NumPy and matplotlib. The input is a random symmetric matrix M, shown in an editable matrix widget. NumPy's linalg.eigh computes the eigenvalues and eigenvectors, and the notebook displays the factorization M = V D Vᵀ as a row of matrix widgets. A plot maps the unit circle and a grid of points through the matrix and draws each eigenvector scaled by its eigenvalue.
The notebook is interactive. Drag a value in M, and marimo re-runs every dependent cell: the decomposition, the plot, and the area summary update. The diagonal matrix D is also editable. Change an eigenvalue, and the notebook builds a modified matrix M* from the same eigenvectors. A switch toggles the plot between M and M*. The plot itself is a selection widget: select a region, and a second plot draws an arrow from each selected grid point to its transformed position.
The initial matrix is A Aᵀ for a random 2x2 matrix A, so it is symmetric and its eigenvalues are real. The matrix widget keeps M symmetric during edits, and only the diagonal of D accepts input. A final cell multiplies the two eigenvalues and shows how this determinant scales the area of the ellipse and sets its orientation.