Vector Puck
by marimo team
Explore vector arithmetic with pucks over matplotlib
About this notebook
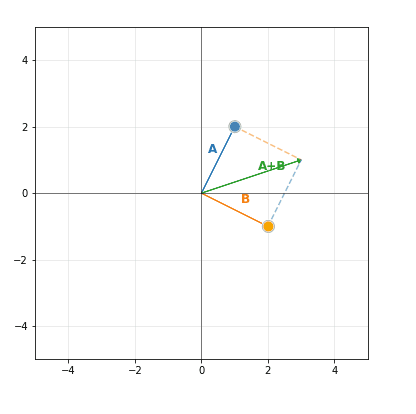
This notebook shows vector operations on a two-dimensional plane. It draws two vectors, called A and B, as arrows from the origin. The vectors have no fixed dataset. Instead the reader sets them by dragging two pucks. The notebook uses marimo, numpy, and matplotlib. It draws the pucks and arrows with the ChartPuck widget from the wigglystuff library.
The reader drags the blue puck to set vector A and the orange puck to set vector B. A dropdown selects one operation from addition, subtraction, or projection. The plot then draws a green arrow for the result. Addition adds dashed parallelogram edges. Subtraction adds a dashed line between the two arrow tips. Projection adds a dashed perpendicular line and a marker on vector B. A text block below the plot lists each vector as coordinates, magnitude, and angle in degrees, plus the result of the chosen operation.
The draw function reads the puck coordinates from the widget and computes each result with plain arithmetic. The projection uses the dot product of A and B divided by the dot product of B with itself. It skips this step when the length of B is near zero. The pucks move within bounds of minus five to five on both axes, and the widget throttles updates to 100 milliseconds.