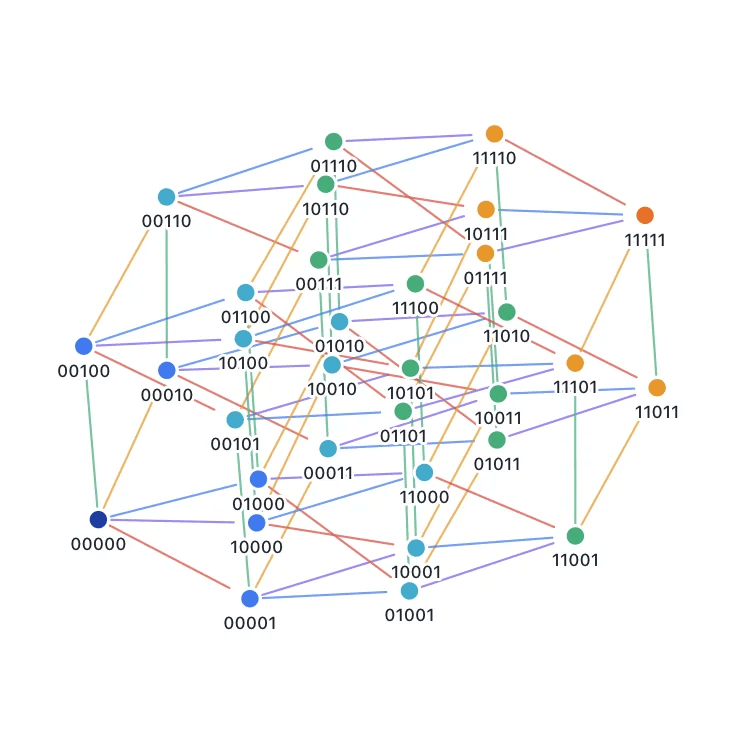
Hypercube Graph
by marimo team
Interactively visualize hypercube graphs in arbitrary dimensions with a force-directed layout.
About this notebook
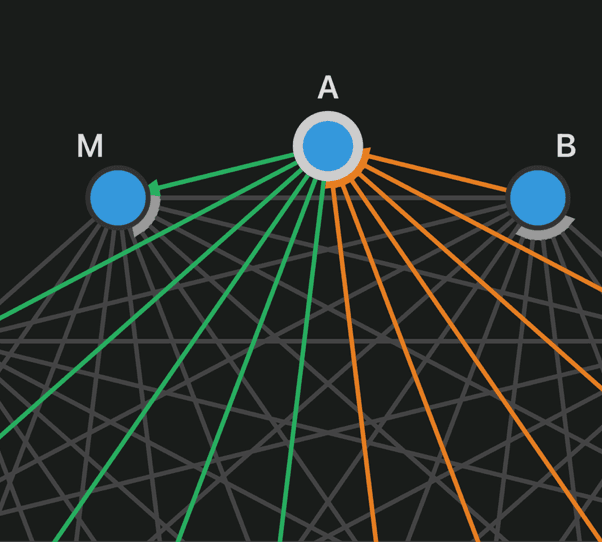
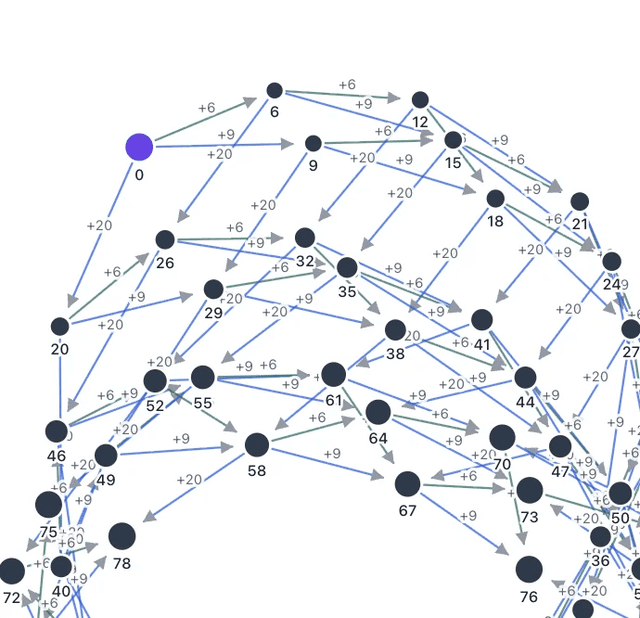
This notebook draws the hypercube graph Q_n. Each vertex is a binary string of length n. Two vertices connect when they differ in exactly one bit. The code builds the nodes and edges in plain Python and renders them with the GraphWidget from the wigglystuff library. The notebook runs on marimo. A force layout positions the nodes, so Q_3 forms a cube and Q_4 projects into a tesseract.
You set the dimension n with a slider from 1 to 6. A second slider sets the node size from 2 to 14 pixels. When you move a slider, the notebook rebuilds the nodes and edges and updates the graph. The nodes are colored by popcount, the number of 1 bits. The edges are colored by the bit position where the endpoints differ. A panel reports n, the vertex count, and the edge count. The same panel shows the hovered node, the selected nodes, and the selected edges as you interact.
The build function assigns each node a label, a color from a fixed palette, and a size. It adds one edge for each bit flip and keeps each pair once. Colors come from two fixed palette lists and repeat with a modulo when the index passes the list length. The edge count uses the formula n times 2 to the power n minus 1.