Conformal Mapping Explorer
by marimo team
How complex functions like z², 1/z, and e^z transform images using an interactive puck.
About this notebook
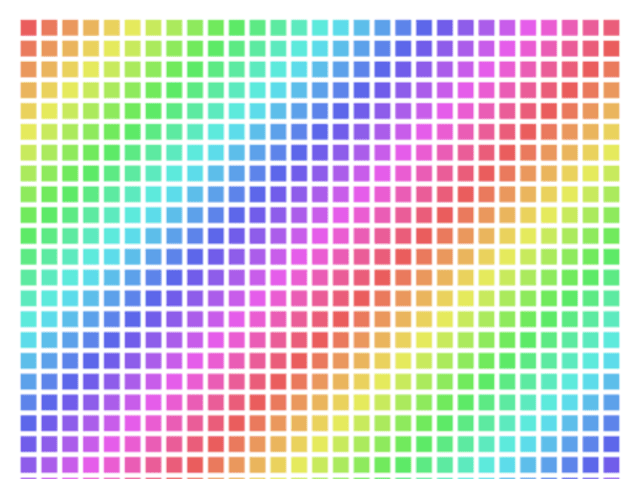
This notebook shows conformal maps in the complex plane. It uses marimo, numpy, and matplotlib. The draggable dot comes from the ChartPuck widget in wigglystuff. The notebook generates its own images with Pillow. It does not read an external dataset. The test images are a checkerboard, a color spectrum, and a polar grid.
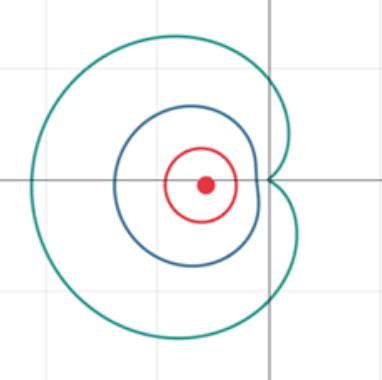
You drag a puck on the left chart. The puck sets a point and its radius. The right chart updates and shows the mapped result. A dropdown selects the complex function. The options are z squared, 1/z, z + 1/z (Joukowski), e^z, and log(z). A second dropdown selects the texture image. A checkbox controls the wrap behavior at the image edge. A slider sets the zoom level for the 1/z checkerboard view. The mapped result can look unexpected.
The image mapping uses scipy.ndimage.map_coordinates. For each output pixel the code finds the source coordinate through the inverse function. The wrap checkbox sets the map_coordinates mode. The checked state uses mode "wrap" and tiles the image. The unchecked state uses mode "constant" and makes outside pixels transparent.