Spectral Denoising
by marimo team
Recover signals from noisy measurements on graphs using the Laplacian as a regularizer.
About this notebook
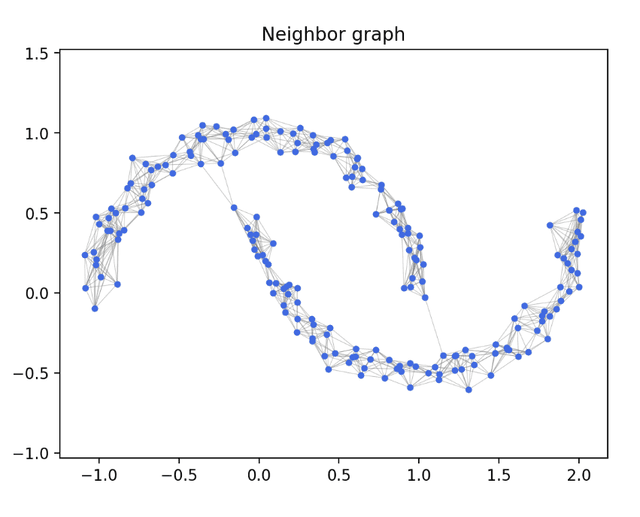
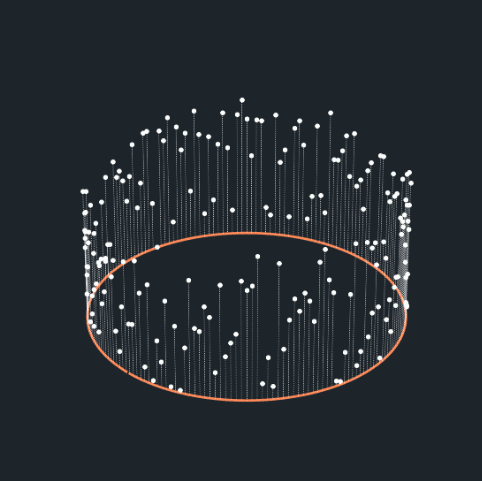
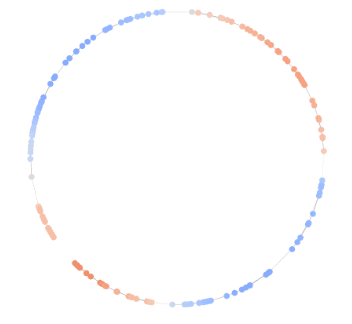
This notebook removes noise from a signal defined on the nodes of a graph, using the eigenvectors of the graph Laplacian. It samples points on the unit circle and builds a k-nearest-neighbor graph with scikit-learn. The signal on the nodes is a sine wave, a step function, or a Gaussian bump, with added Gaussian noise. NumPy computes the Laplacian eigendecomposition and matplotlib draws the plots.
A dropdown selects the signal shape. Four sliders control the number of nodes, the number of neighbors, the noise level, and the number of eigenvector components to keep. When you move a slider, marimo re-runs the dependent cells and redraws every plot. The plots show the clean, noisy, and denoised signals on the graph, the same three signals as a line chart, and the spectral coefficients as a bar chart with the cutoff marked.
The denoising step is an orthogonal projection: the notebook computes the signal's coefficients in the Laplacian eigenbasis and sets all but the first k to zero. A fixed random seed makes the graph and the noise the same on every run with the same settings. Markdown cells state the math behind each step.