Spectral Clustering
by marimo team
Using eigenvectors of the Laplacian to cluster data where k-means fails.
About this notebook
This notebook shows spectral clustering on synthetic data with scikit-learn, NumPy, and matplotlib. A dropdown selects the dataset: two moons or concentric circles, each with 200 points from scikit-learn's make_moons or make_circles. Plain k-means fails on the raw points, and the notebook plots that failure next to the raw data. Spectral clustering recovers the natural clusters from the eigenvectors of a graph Laplacian.
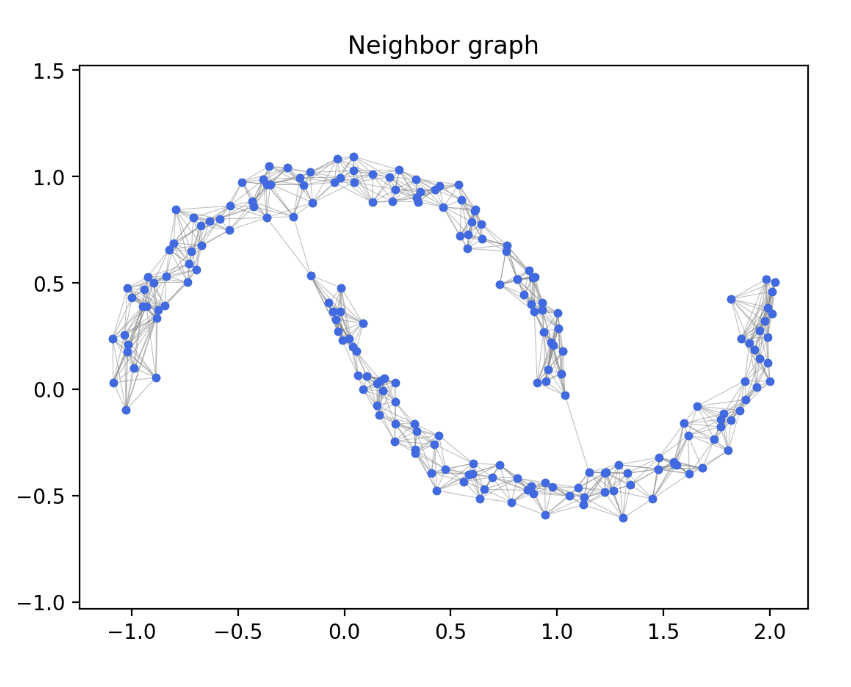
A slider sets the number of nearest neighbors, from 3 to 20. The notebook builds a k-nearest-neighbor graph with scikit-learn's NearestNeighbors and symmetrizes the adjacency matrix. When you move the slider, marimo re-runs every dependent cell. The plots then show the adjacency matrix as an image, the neighbor graph drawn over the points, the entries of the Fiedler eigenvector, and the final cluster assignment.
The notebook forms the Laplacian as the degree matrix minus the adjacency matrix and computes its eigenvectors with numpy.linalg.eigh. It applies k-means with two clusters to the Fiedler eigenvector, which separates the entries into two groups. Markdown cells state the definitions and the spectral properties that make this work.