Spectral Graph Drawing
by marimo team
Drawing graphs via eigenvectors of the graph Laplacian.
About this notebook
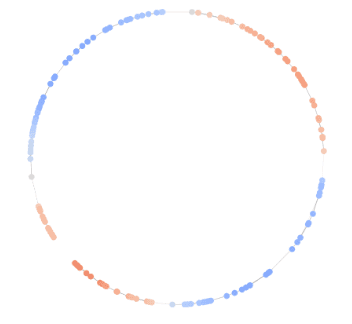
This notebook draws graphs with eigenvectors of the graph Laplacian, using NumPy and matplotlib. It generates the graph itself: a dropdown offers a path, a cycle, a grid, the Petersen graph, or an Erdős–Rényi random graph. The notebook builds the adjacency matrix, forms the Laplacian L = D − A, and computes its eigendecomposition with numpy.linalg.eigh. Two eigenvectors serve as the x and y coordinates of the nodes.
Sliders set the number of nodes and, for the random graph, the edge probability. Two more sliders choose which eigenvectors give the x and y coordinates, and a radio button picks the eigenvector that colors the nodes. When you move a control, marimo re-runs the dependent cells and redraws two plots: the same graph in a random layout and in the spectral layout. A bar chart of the Laplacian spectrum highlights the two selected eigenvalues.
The default choice is the second and third smallest eigenvectors, which give the classical spectral drawing. These eigenvectors minimize the sum of squared distances between connected nodes, so the layout follows the connectivity of the graph. The random graph uses a fixed seed, so the same parameters always produce the same graph.