Visualizing Embeddings
by marimo team
Select points in embedded space to understand clusters better.
About this notebook
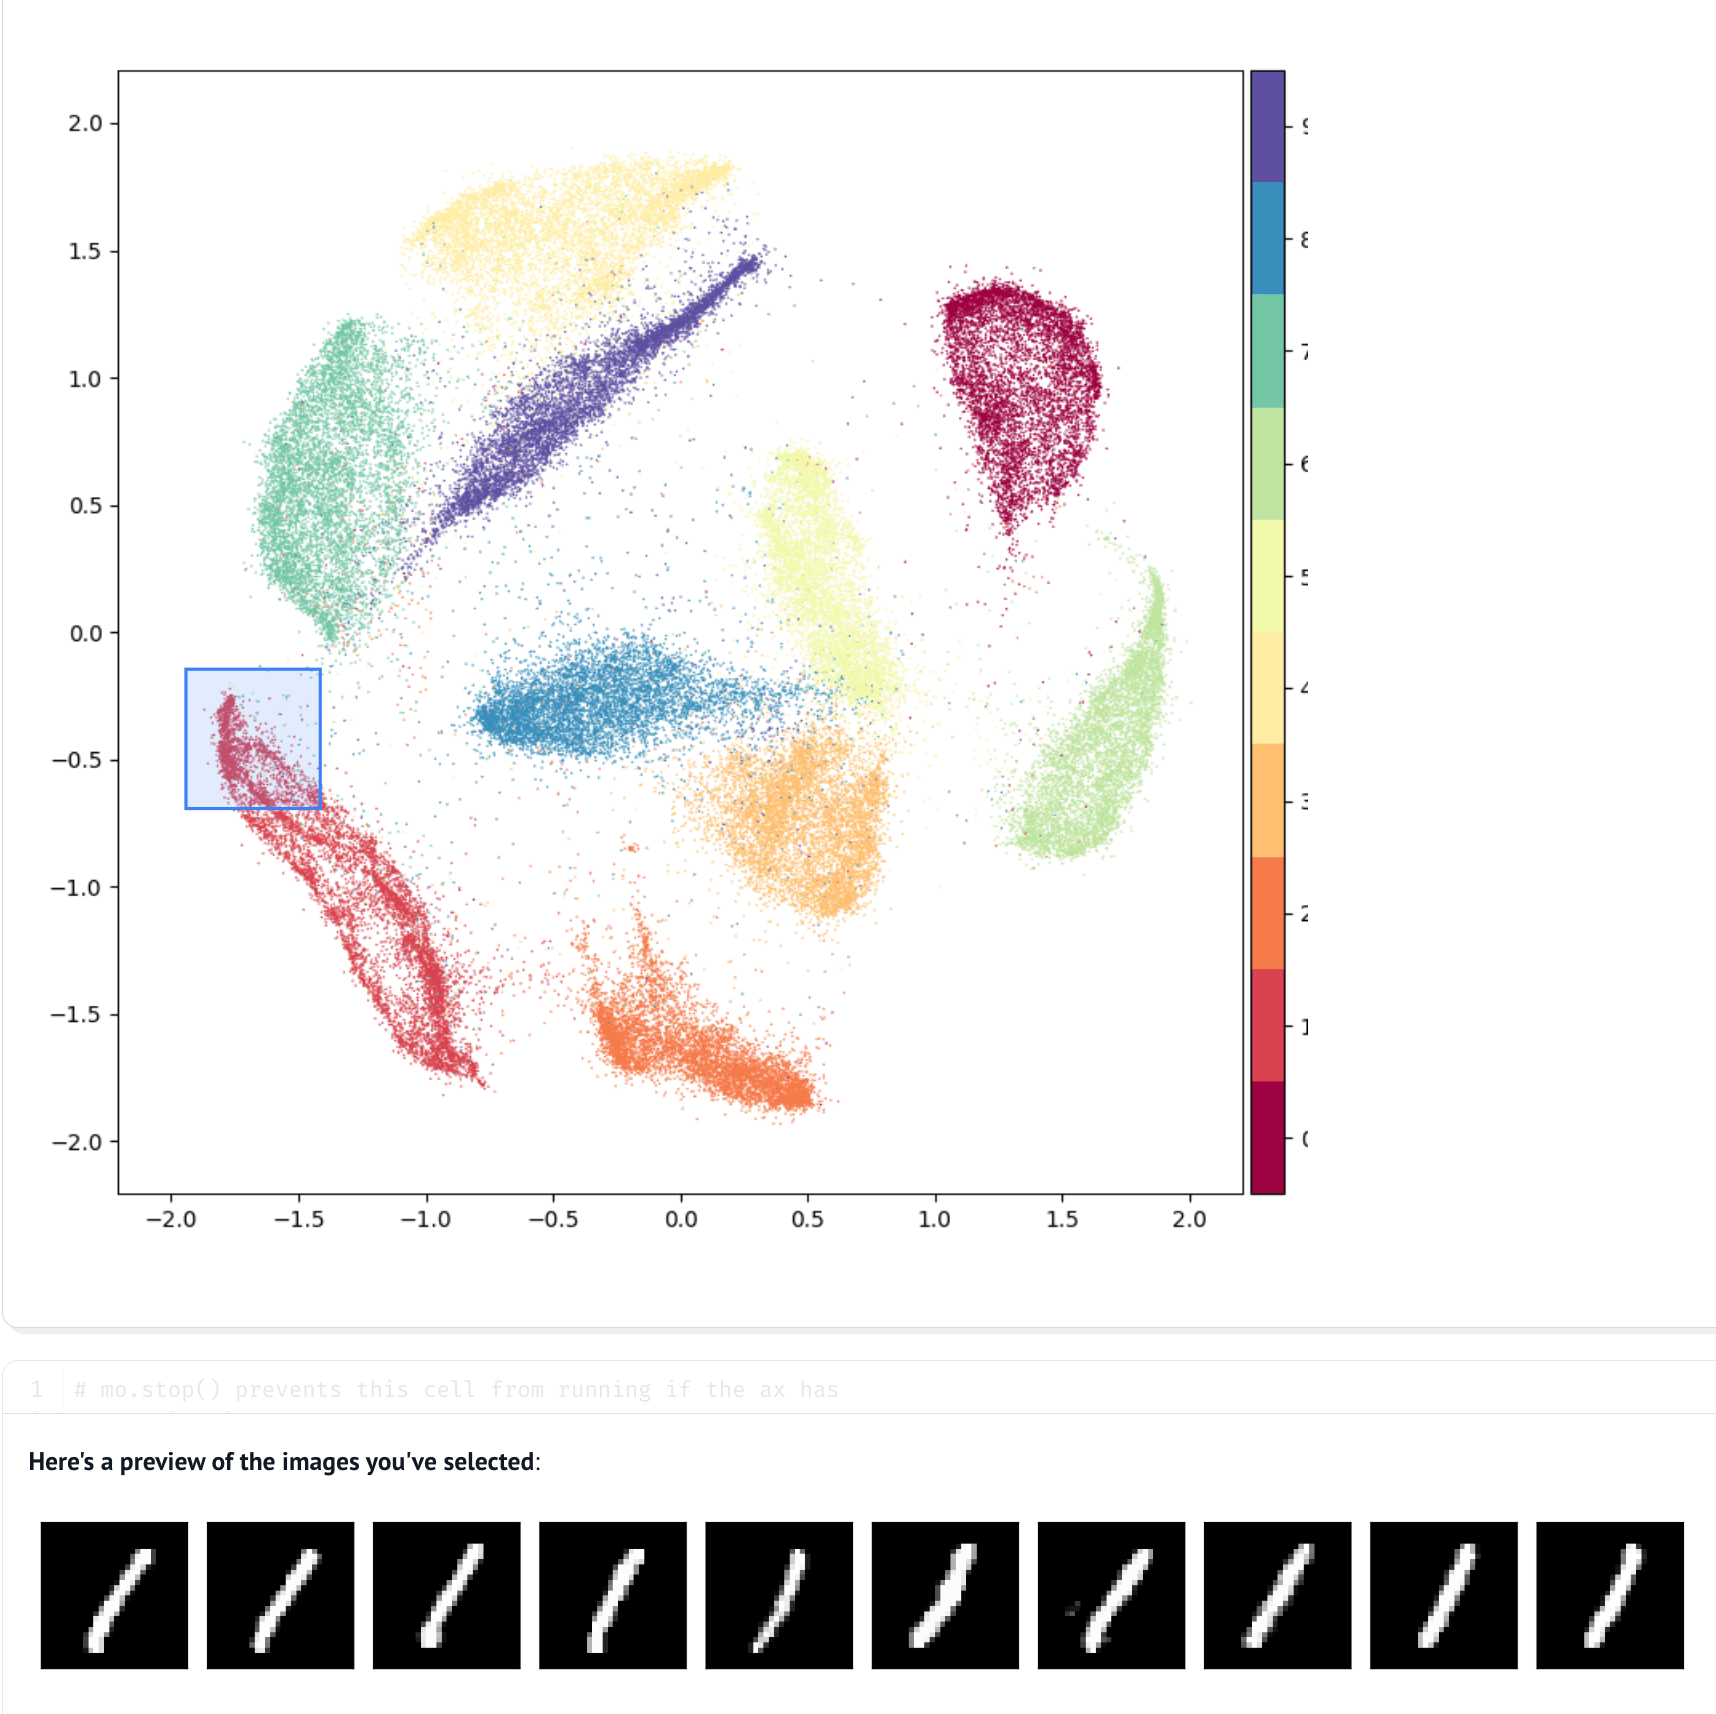
This notebook embeds the MNIST handwritten digits into two dimensions with PyMDE and plots the result as a scatter plot. Each point is one digit image, colored by its digit class, and similar digits appear close to each other.
The scatter plot is interactive. marimo wraps the matplotlib figure in a selection widget: select a region with your mouse, and marimo re-runs every cell that depends on the selection. Those cells preview up to ten of the selected digit images and show the full selection as a data table.
The embedding comes from PyMDE's preserve_neighbors method and runs on a GPU when one is available. marimo's persistent cache stores the result, so the notebook computes the embedding once and loads it instantly on later runs.