Dicekit
by marimo team
An interactive exploration of dice probability calculations and distributions.
About this notebook
This notebook presents dicekit, a small Python library for dice and probability. The main object is a Dice, which holds a probability for each outcome. The notebook uses marimo, pandas, and hastyplot. It also uses the standard library modules fractions, statistics, itertools, and collections. The notebook does not read an external dataset. Instead it computes probability distributions from the dice you declare. You can add and subtract dice like normal Python numbers.
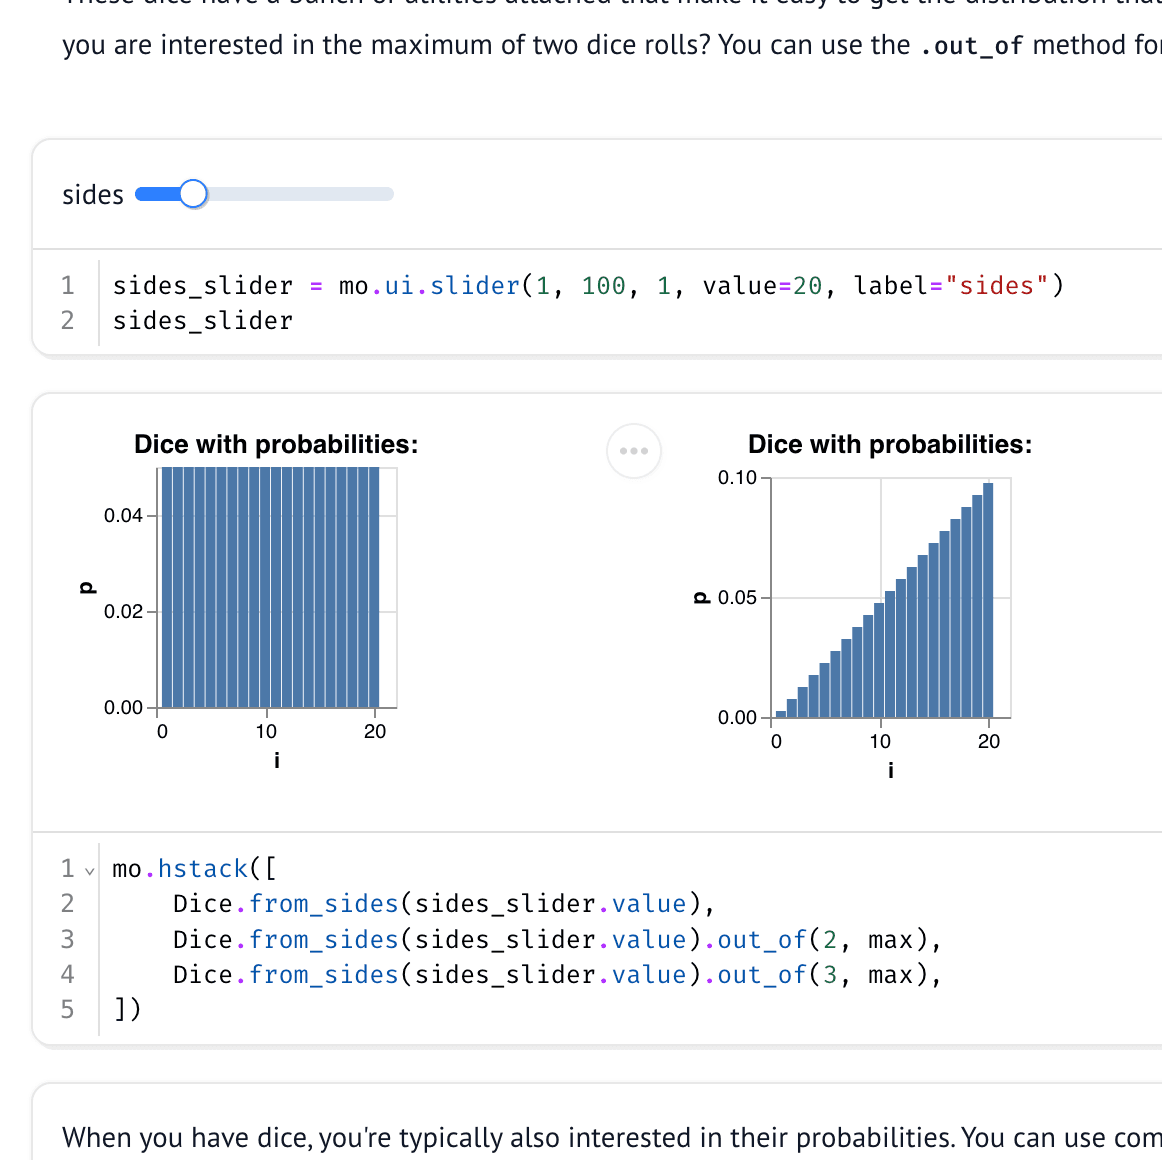
A slider sets the number of sides on a dice, from 1 to 100. When you move the slider, three bar charts update next to each other. The first chart shows one dice. The second and third charts show the maximum of two and three rolls, through the out_of method. Each Dice renders its probability chart by default. You can also call cdf_chart to see the cumulative distribution.
The author defines and maintains the library inside this marimo notebook. You can read the full Dice and Vase implementation in the notebook cells. Probabilities are floating point by default. You can build a dice from fractions.Fraction weights to keep exact values through arithmetic. The from_dist method approximates a continuous distribution. It samples the density of an object such as statistics.NormalDist across an evenly-spaced grid.