About this notebook
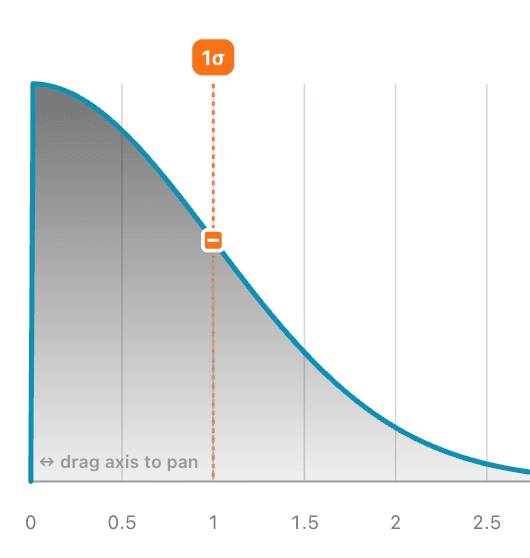
modist is a library of interactive distribution widgets for marimo, and this notebook demonstrates it. The notebook uses modist, numpy, scipy, and matplotlib. It covers fifteen distribution families, among them Normal, Beta, Gamma, StudentT, and Weibull. Each widget draws a density curve as an SVG. You drag shapes on the curve to set the parameters instead of moving sliders.
A table lists every family with its parameters and its domain. Pick a family and the notebook shows that widget. All fifteen share one set of controls: a center line or dot moves the curve, and quantile squares set the spread. StudentT and Weibull add an extra dial. As you drag, the panels below update. They show the canonical parameter dict, summary statistics from scipy (mean, median, standard deviation, and the 5 and 95 percent quantiles), and a quantile lookup driven by a slider. A matplotlib histogram plots 4000 random draws against the density.
Each widget reports its state three ways: a plain dict through .value, a frozen scipy distribution through .scipy, and a PyMC distribution through .pymc. md.ui.create_tabs groups several distributions into one prior panel. md.pymc.create_priors replaces a PyMC model's root priors with these widgets, then rebuilds the model for sampling. PyMC needs a server-side kernel, so that section stays inactive in the browser while the rest of the notebook runs in WASM.