Deck.gl Hexagon Heatmap
by Scott Lemke
Interactive 3D hexagonal heatmap on a map with adjustable radius, coverage, and elevation.
About this notebook
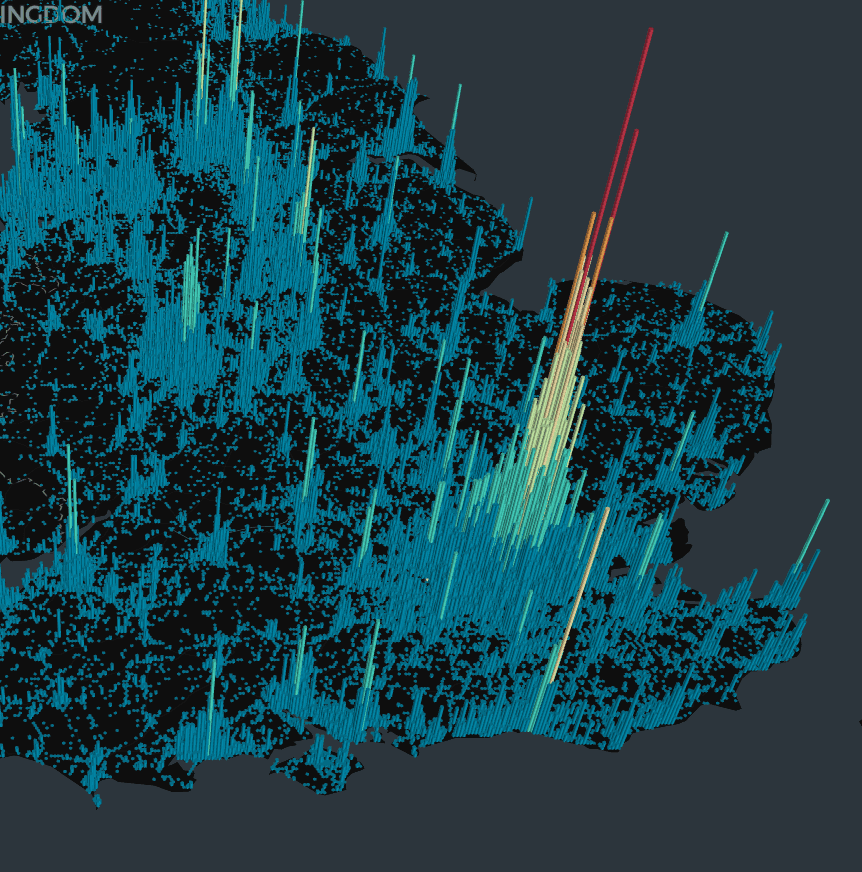
This notebook draws a 3D hexagon heatmap on a map. It reads the deck.gl heatmap sample dataset from the visgl/deck.gl-data repository. The data is a CSV of longitude and latitude points near the United Kingdom. The notebook uses pandas to load the CSV, deckgl_marimo to render the map, and marimo for the interface. It bins the points into hexagons and shows each bin as an extruded column.
You control the map with three sliders. The radius slider sets the hexagon size. The coverage slider sets how much of each cell the hexagon fills. The elevation scale slider sets the column height. When you move a slider, the notebook rebuilds the layer and updates the existing map. The map keeps its camera position because it lives in a cell with no slider dependencies. A table below the map reads the viewport and shows the current longitude, latitude, zoom, pitch, and bearing.
The map starts with a dark basemap, a fixed center point, and a 40.5 degree pitch. The layer update relies on marimo reactivity and traitlet sync, so the map object is not recreated on each change. The viewport table updates from the widget value when you pan or zoom the map.