When Europeans Fly Nest
An analysis of when Europeans leave their parental home.
About this notebook
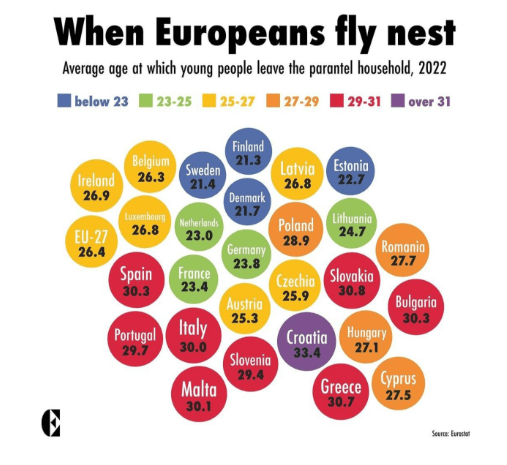
This notebook redesigns a bubble chart of Eurostat data: the average age at which young people leave the parental home in 27 EU countries. It recreates the 2022 values in a pandas DataFrame and rebuilds the chart three ways: a horizontal bar chart and a grouped bubble chart in Altair, and a choropleth map in Plotly. A seaborn palette replaces the rainbow colors of the original chart.
Three dropdowns control the charts. The first sorts the bar chart by average age or by country name. The second sorts a ranged dot plot that compares females and males in 2022. The third selects the gender for two heatmaps that cover the years 2015 to 2024. When a dropdown changes, marimo re-runs every cell that depends on it. Each chart also shows exact values in tooltips.
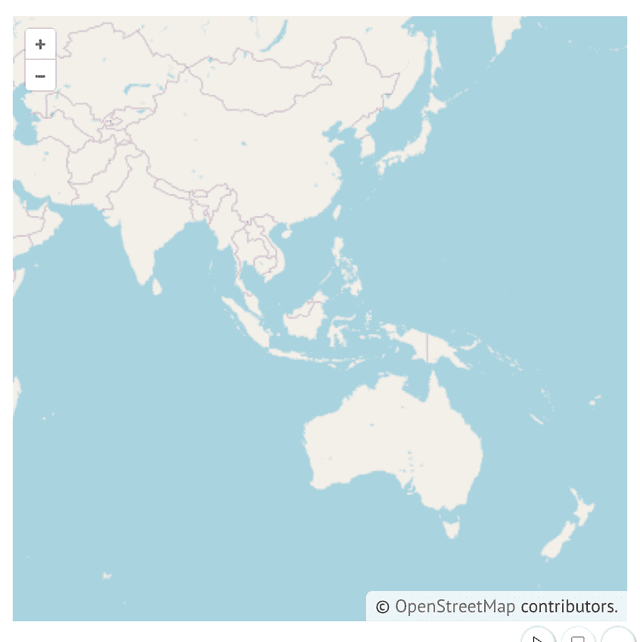
The second part loads a larger Eurostat dataset from GitHub, with one column per year and a sex column with three values. The notebook restricts this data to the 27 EU member states, compares the 2022 values with the recreated dataset, and converts the table to long format with pandas. A final Plotly choropleth map animates the values by year.