Earthquakes
by marimo team
Highlight all known earthquakes on the openlayers map.
About this notebook
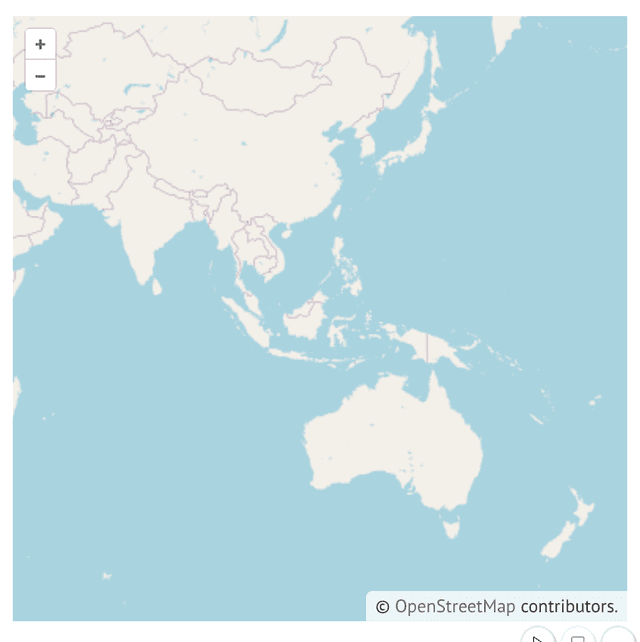
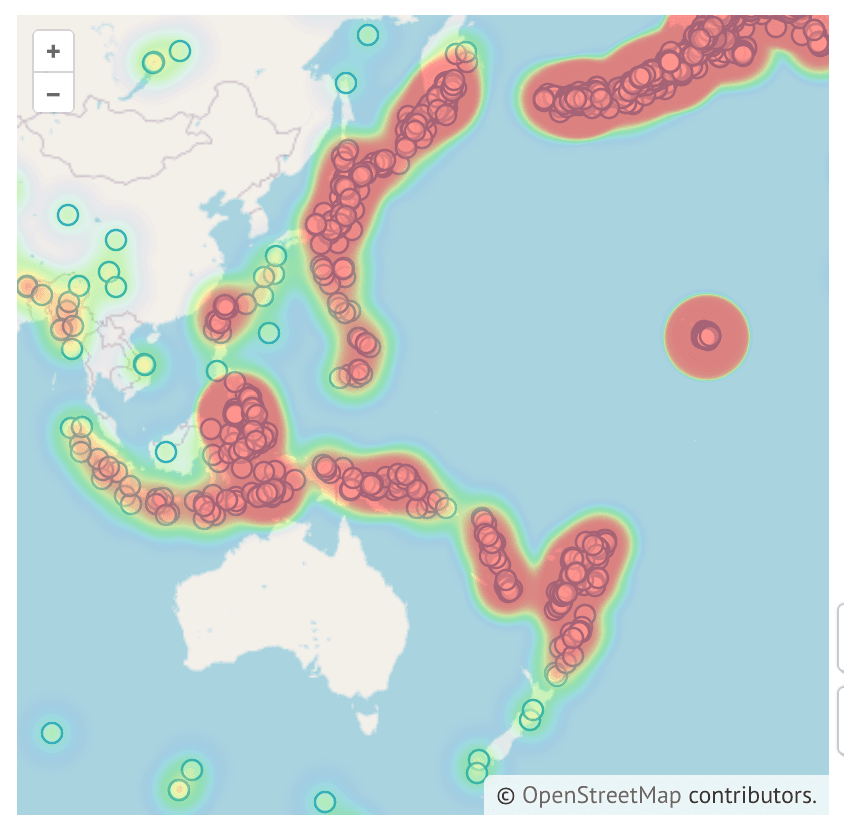
This notebook plots one month of earthquake data on an interactive world map with the openlayers package. It reads the USGS GeoJSON feed of all earthquakes from the past month. Each earthquake appears two times: as a point in a vector layer, and in a heatmap layer that weights each point by its magnitude.
The map is an openlayers MapWidget with a basemap, the vector layer, and the heatmap. A tooltip shows the data of the feature under the pointer. Two marimo sliders control the radius and the blur of the heatmap. Each slider change calls setRadius or setBlur on the heatmap layer directly, so marimo does not rebuild the map widget.
Both layers read the GeoJSON directly from the USGS URL through an openlayers VectorSource, so the notebook stores no local data. The heatmap renders at half opacity above the vector points.