Loss Landscape Visualization
by marimo team
Visualize neural network loss landscapes in 3D; inspired by Ziming Liu.
About this notebook
This notebook trains a small multilayer perceptron on a one-dimensional regression task and plots the loss landscape around its weight trajectory with matplotlib. You choose the target function: x, x², x³, or sin(3x). The training data is 1,000 random inputs from the interval [-1, 1]. The landscape comes from the local-plane method in a blog post by Ziming Liu.
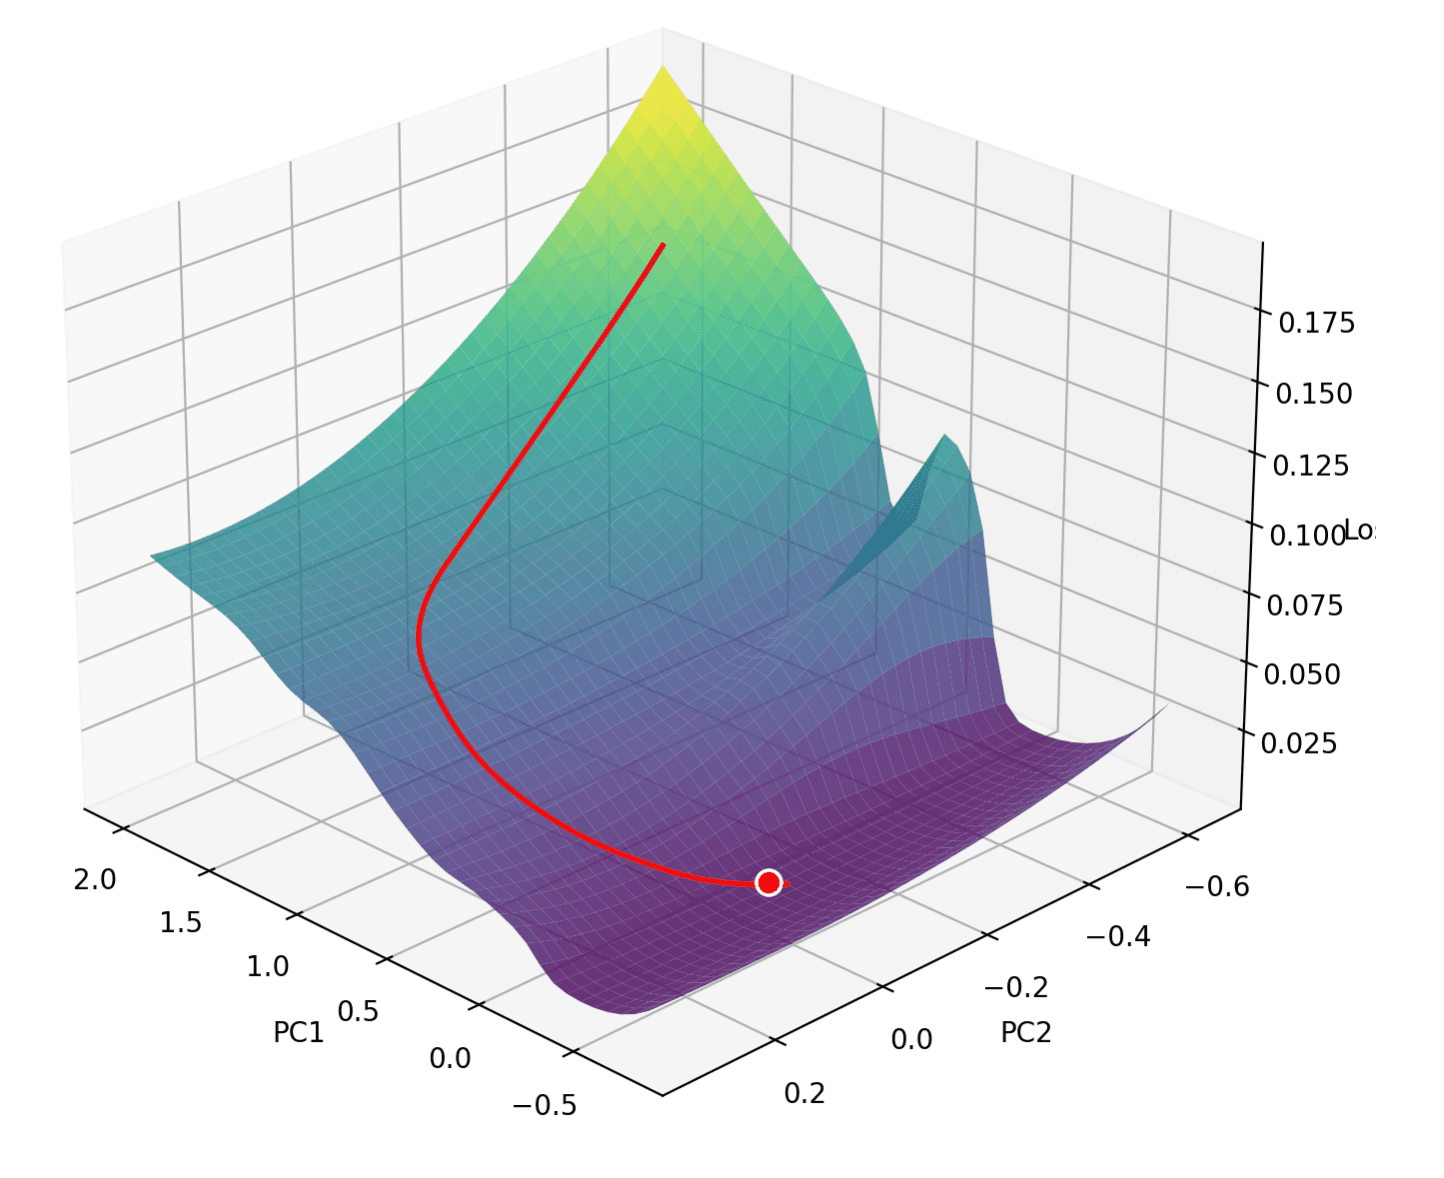
A form collects the network, training, and landscape settings. The cells below it wait until you click Train & Visualize. The notebook then trains the network, plots the loss curve on a log scale, and computes the landscape grid. A slider selects a training step, and a red marker with a trail shows the optimizer's position on the 3D surface. A heatmap and a second 3D surface show the full trajectory from start to end.
The notebook implements the network, backpropagation, and the Adam optimizer in plain NumPy, with SiLU activations and Xavier initialization. scikit-learn's PCA projects the weight snapshots to two dimensions and defines the grid. Along the trajectory, the code builds local planes from the velocity and acceleration directions. The landscape blends the loss from these planes at each grid point, and a loss cap clips extreme values.