Borsuk-Ulam Theorem
by marimo team
Can you draw a counter-example of the Borsuk-Ulam Theorem? Probably not.
About this notebook
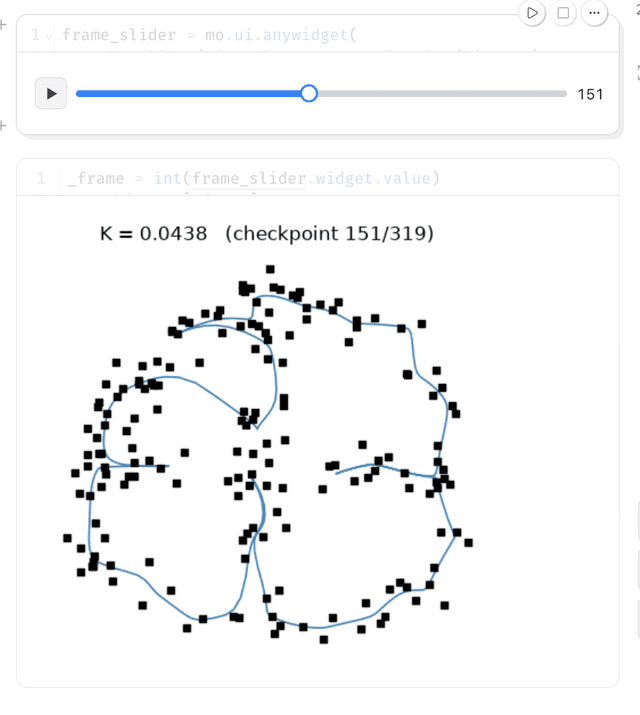
This notebook shows the 1D case of the Borsuk-Ulam theorem. The theorem states that a continuous function on a circle has two antipodal points with equal values. There is no fixed dataset. You draw the input points yourself. The notebook uses numpy for the math, matplotlib for the plots, scipy for smoothing, and the drawdata ScatterWidget to capture your drawing.
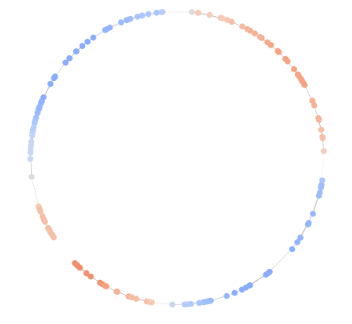
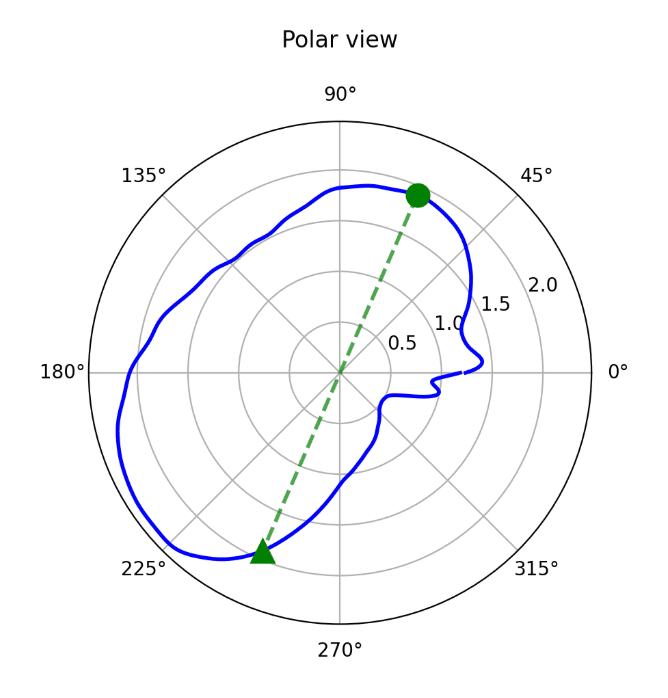
You draw points on a canvas. The x-coordinate becomes the angle theta in the range 0 to 2 pi. The y-coordinate becomes the function value f(theta). A slider sets the smoothing amount sigma from 1 to 30. The notebook needs at least 3 points before it plots anything. It then shows three panels. The first panel plots your function and its shifted copy f(theta + pi), with a marked antipodal pair. The second panel plots g(theta) = f(theta) - f(theta + pi) and marks the zero crossing. The third panel shows the same curve in a polar view. The theorem guarantees that a zero crossing always exists, so you can try to draw a case where it does not.
The notebook reads the drawn points as a polars dataframe and sorts them by x. It normalizes x to 0 to 2 pi and y to -1 to 1. It interpolates the points onto a grid of 500 values and closes the loop so the last value equals the first. It applies a Gaussian filter with wrap mode so the smoothing respects the circle. It finds sign changes in g and refines the best one with linear interpolation to locate theta*.