Evolutionary Strategies
by marimo team
Interactive exploration of evolutionary optimization algorithms
About this notebook
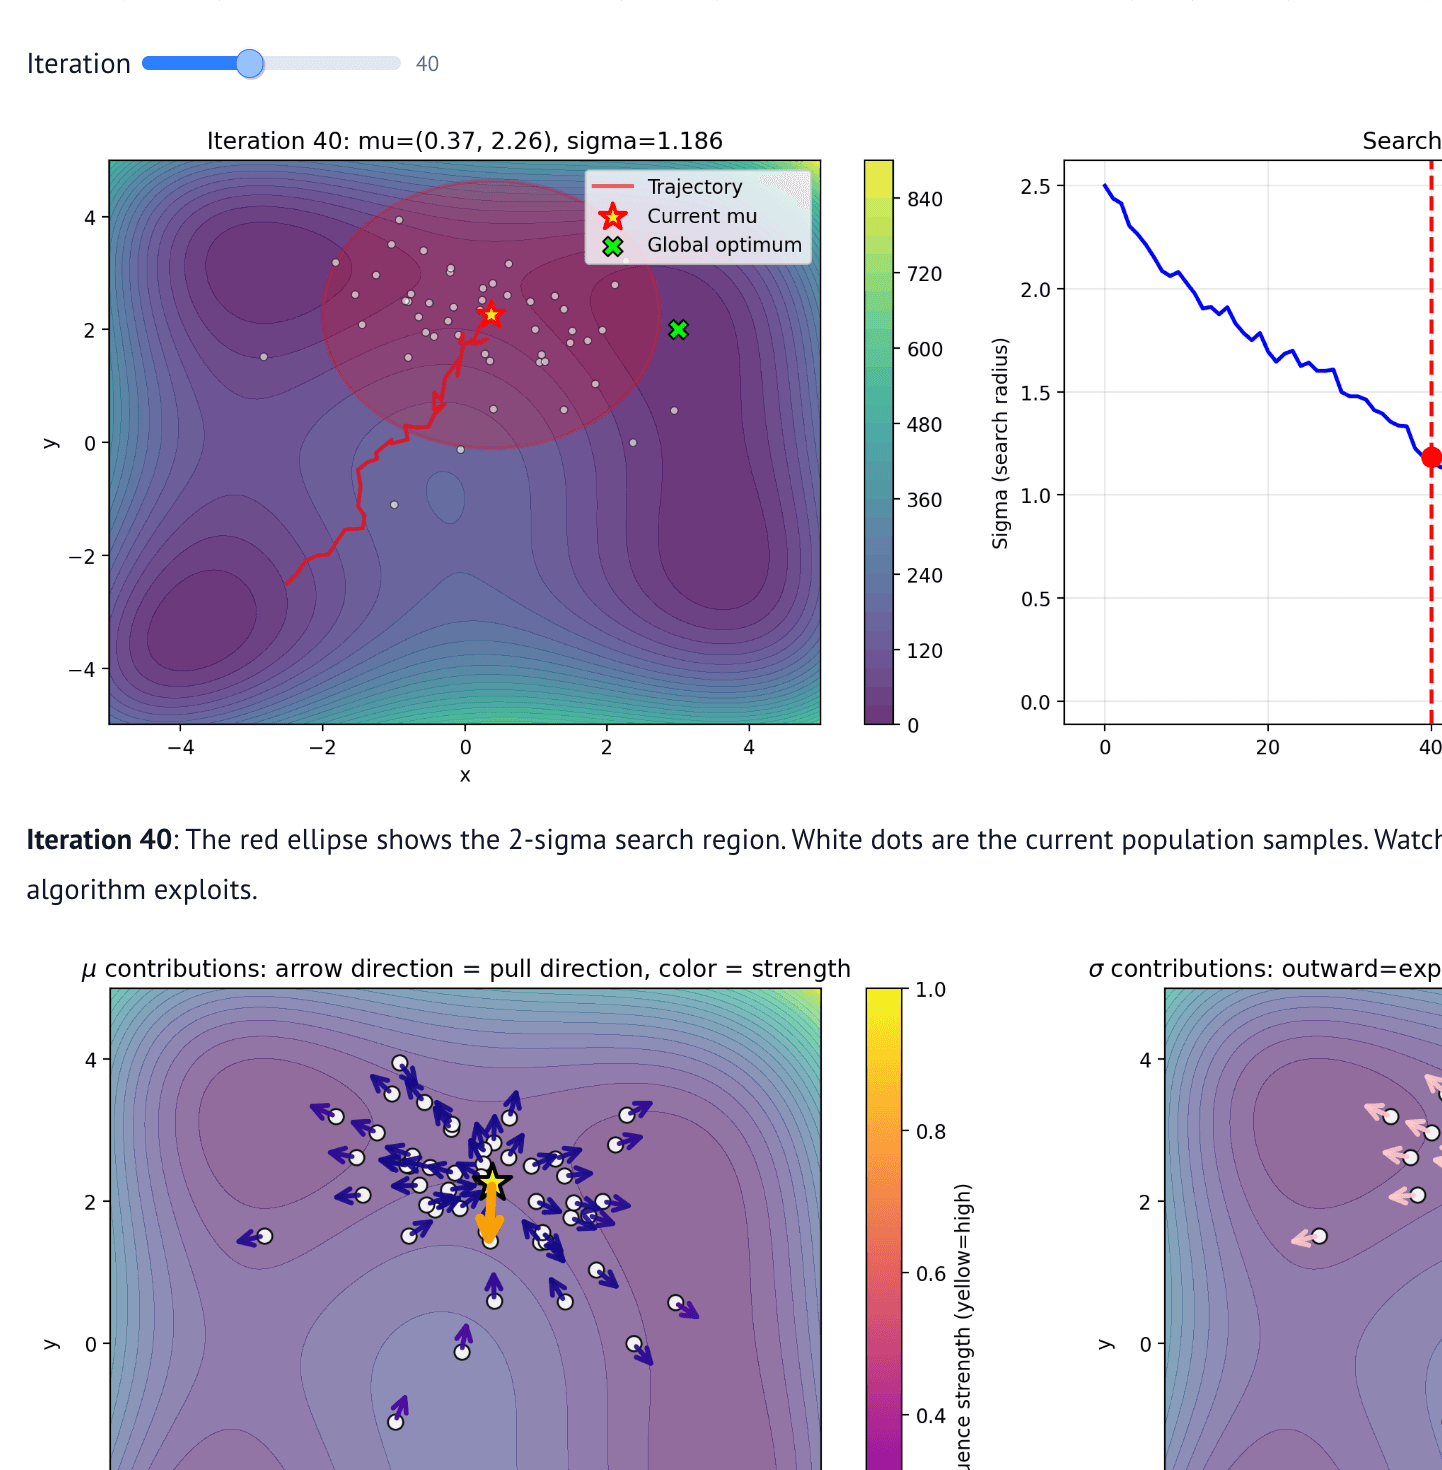
This notebook runs an evolutionary strategy (ES) on two-dimensional test functions. The functions are standard optimization benchmarks such as Sphere, Rosenbrock, Rastrigin, Ackley, Schwefel, and Himmelblau. The code uses NumPy for the sampling and the update rules. It uses Matplotlib for the contour plots and the arrows. The ES keeps a mean mu and a scalar standard deviation sigma. It samples a Gaussian population, scores each sample, and updates both mu and sigma each step.
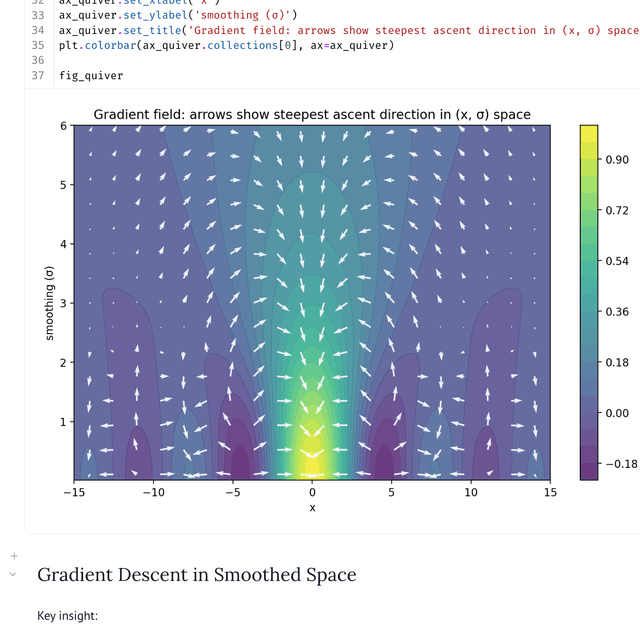
You pick a test function from a dropdown. Sliders set the population size, the two learning rates, the iteration count, the start position, and the initial sigma. The notebook then runs the ES and stores the full history. An iteration slider lets you step through each iteration. You see the landscape with the current samples, the mean, the trajectory, and a red 2-sigma search ellipse. A second plot shows how sigma changes across all iterations. Extra charts draw per-sample arrows for the mu and sigma updates, where color encodes the strength of each contribution.
The search grid computation is cached with an lru_cache decorator, so slider changes redraw faster. Each ES run uses a fixed random seed of 42, so the same settings give the same result. The sigma value is clipped to the range 0.01 to 100.0. The notebook describes isotropic ES, and it notes that CMA-ES and related methods may handle direction-dependent search.