Matplotlib selections
by marimo team
Select data points on a scatter plot and get them back in Python.
About this notebook
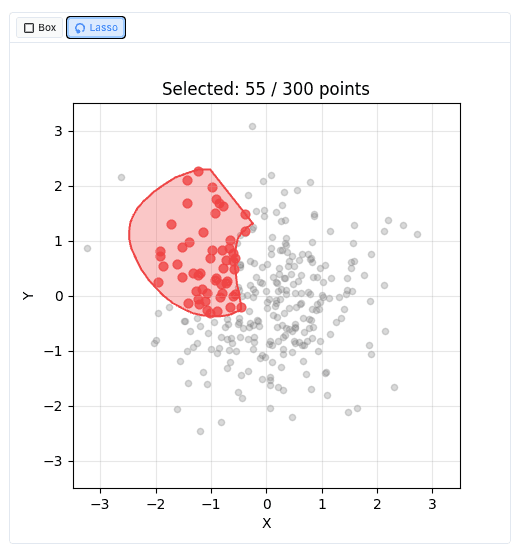
This notebook plots 300 random points with matplotlib and makes the scatter plot selectable with mo.ui.matplotlib. NumPy generates the x and y coordinates from a standard normal distribution with a fixed seed, so the plot looks the same on every run.
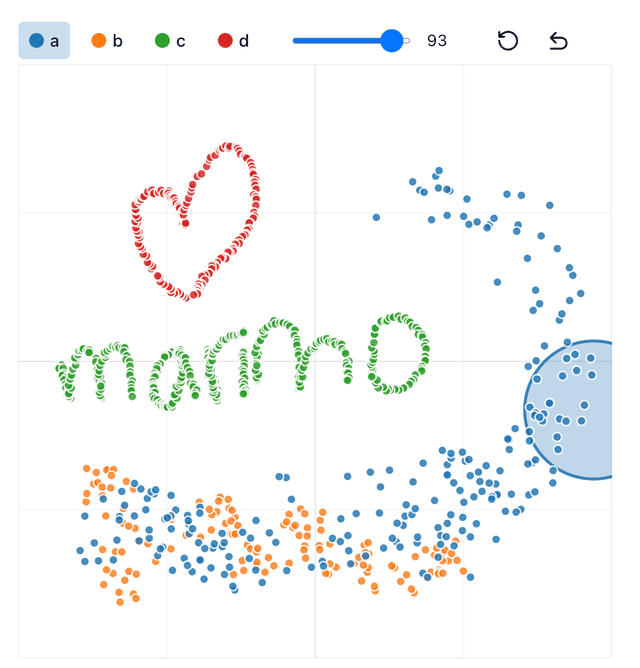
The selection works with the mouse. Drag to draw a box, or hold Shift and drag to draw a lasso. Click outside the selection to clear it. When the selection changes, marimo re-runs every cell that depends on the widget.
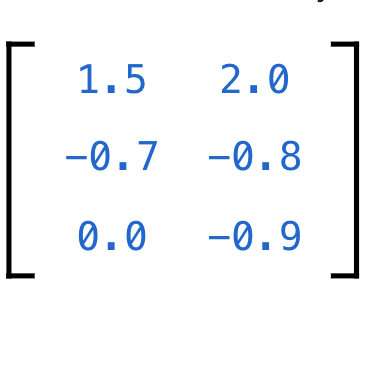
A downstream cell reads the selection from the widget's value. It calls get_mask on the x and y arrays to get a boolean mask, then stacks the selected coordinates into a two-column array and shows them.