About this notebook
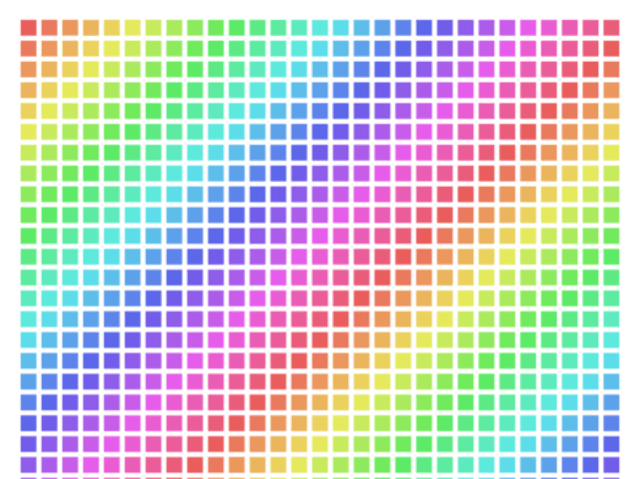
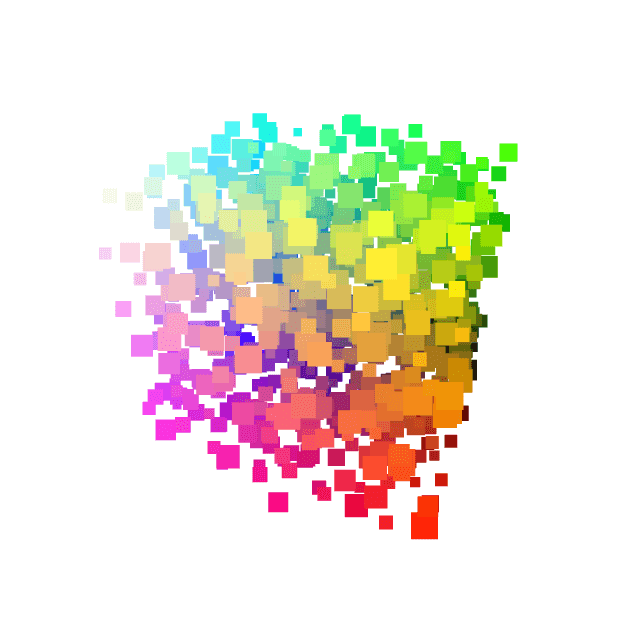
This notebook draws a 3D scatter plot of 900 random colors. The code uses Python's random module to make each point. It sets a fixed seed of 42 so the colors stay the same on each run. Each point gets a red, green, and blue value from 0 to 255. The code maps these values to x, y, and z coordinates and to a hex color. The notebook renders the points with the ThreeWidget class from the wigglystuff library. It wraps the widget with mo.ui.anywidget so marimo can show it.
The reader sees a rotating cloud of colored dots inside a 640 by 420 view. The notebook starts the rotation with start_rotate at speed 10.0. Two buttons sit above the plot. The "make some noise" button moves each point by a small random offset. The "reset" button returns every point to its start position. Both buttons animate the change over 650 milliseconds.
The shuffle button adds a larger random offset on the y axis than on the x and z axes. It reads the current point positions from the widget before it applies each offset. The reset button uses the original data list, so the points always return to the same layout.