
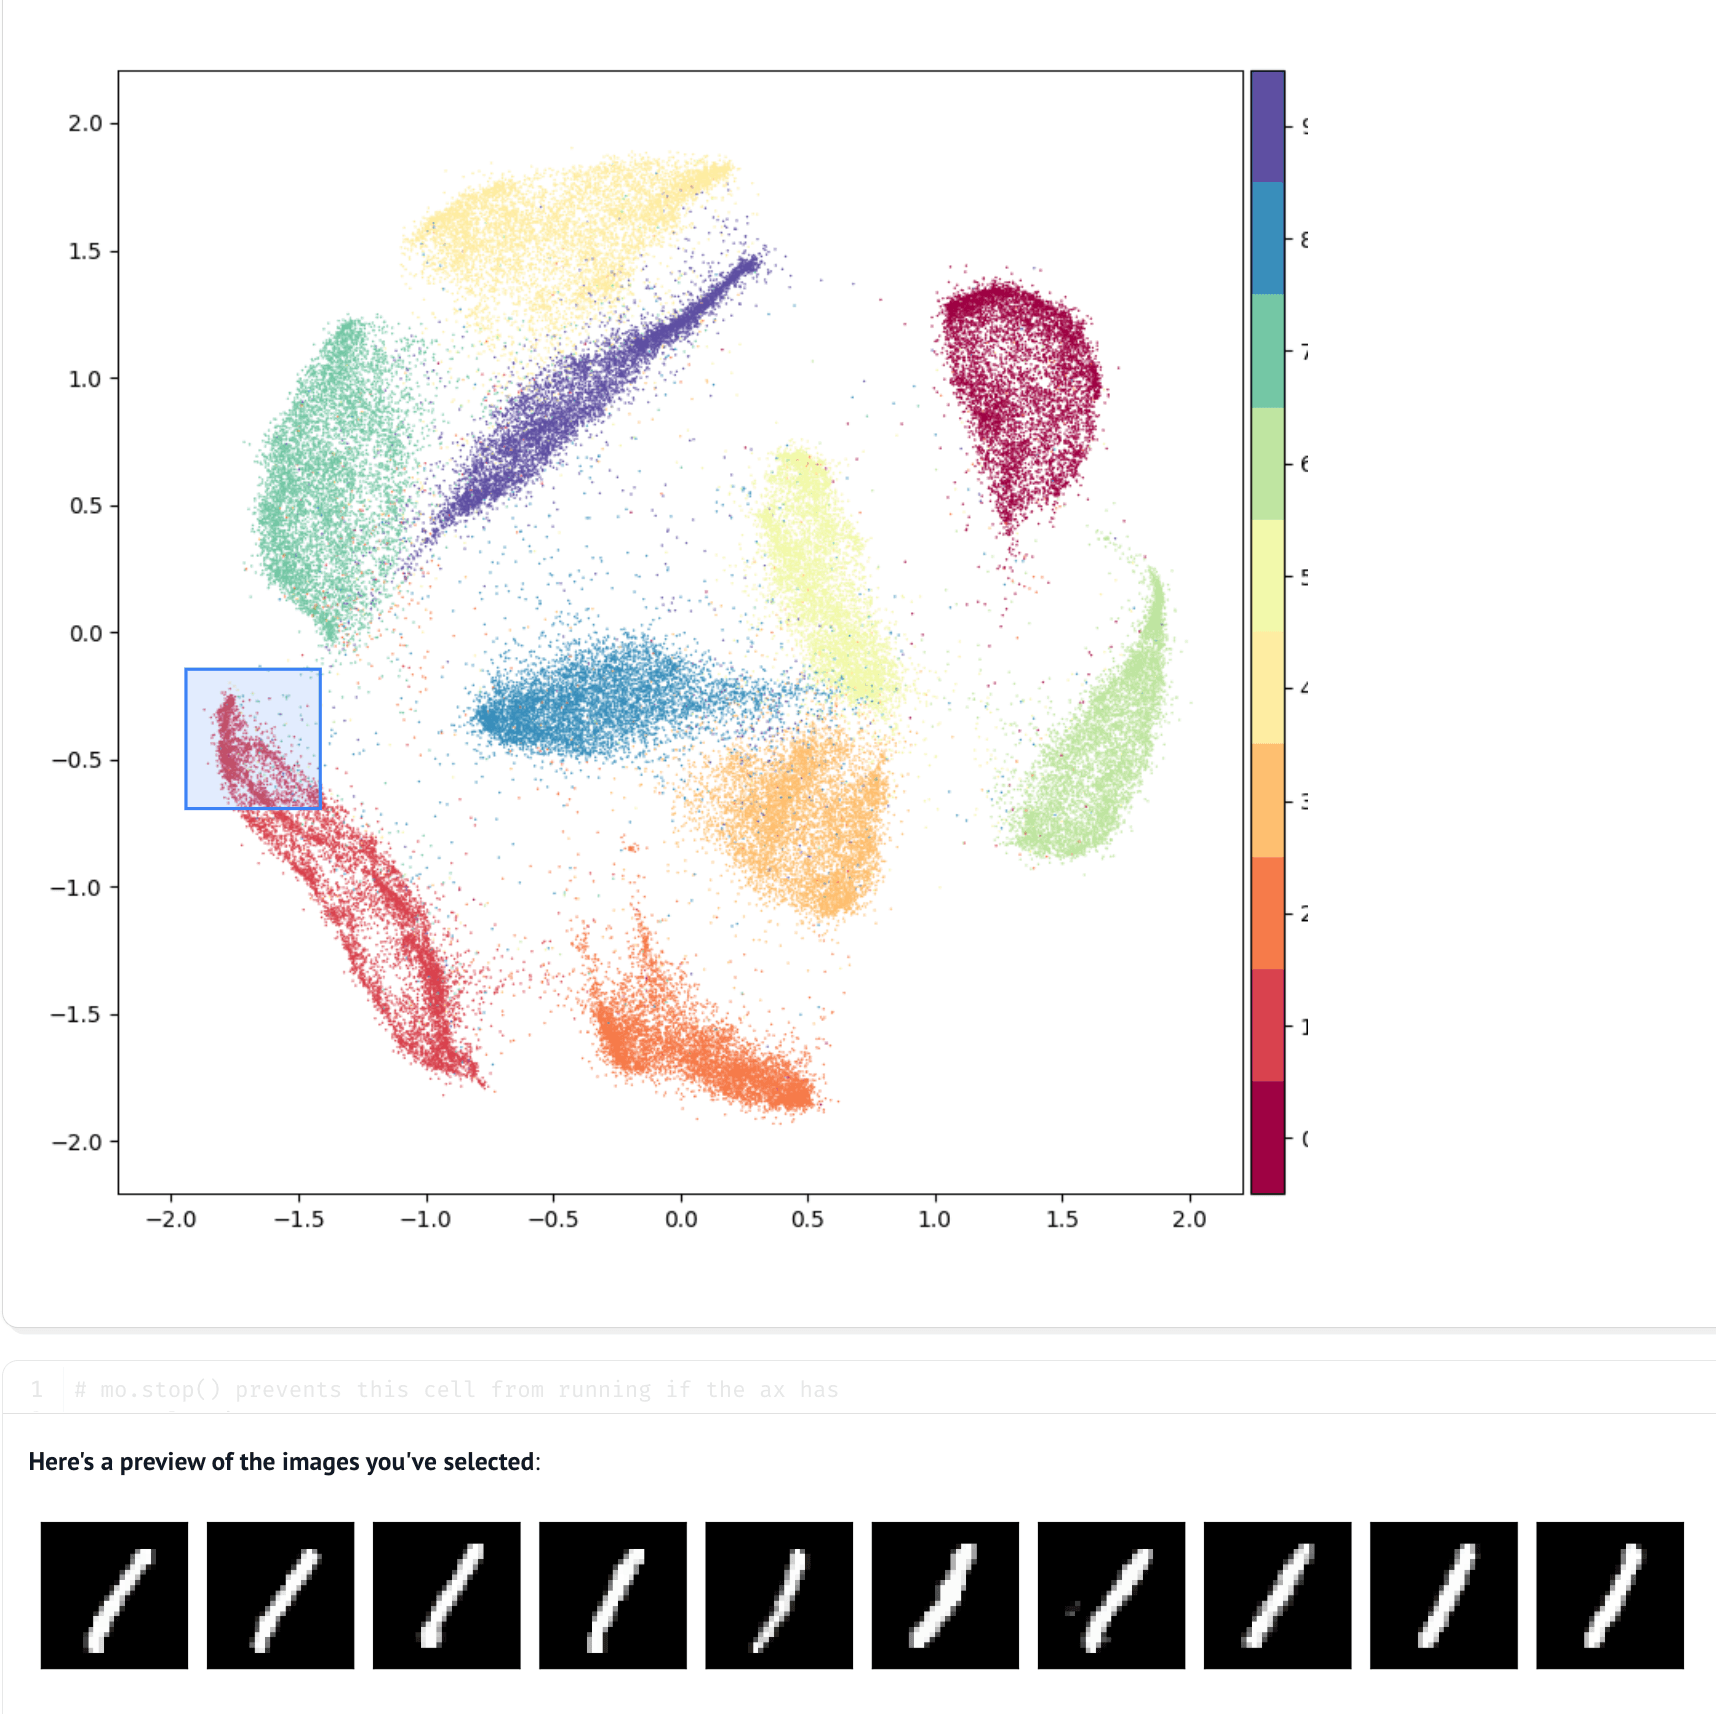
Visualizing Embeddings
Select points in embedded space to understand clusters better.
matplotlibml
🎓 Classes using marimo. See how educators across the world teach with marimo.
Get inspired by this curated gallery, made with marimo: the open-source reactive Python notebook.
Share your molab notebook on socials and tag us for a chance to be featured: X · LinkedIn · Bluesky · Reddit
Select points in embedded space to understand clusters better.
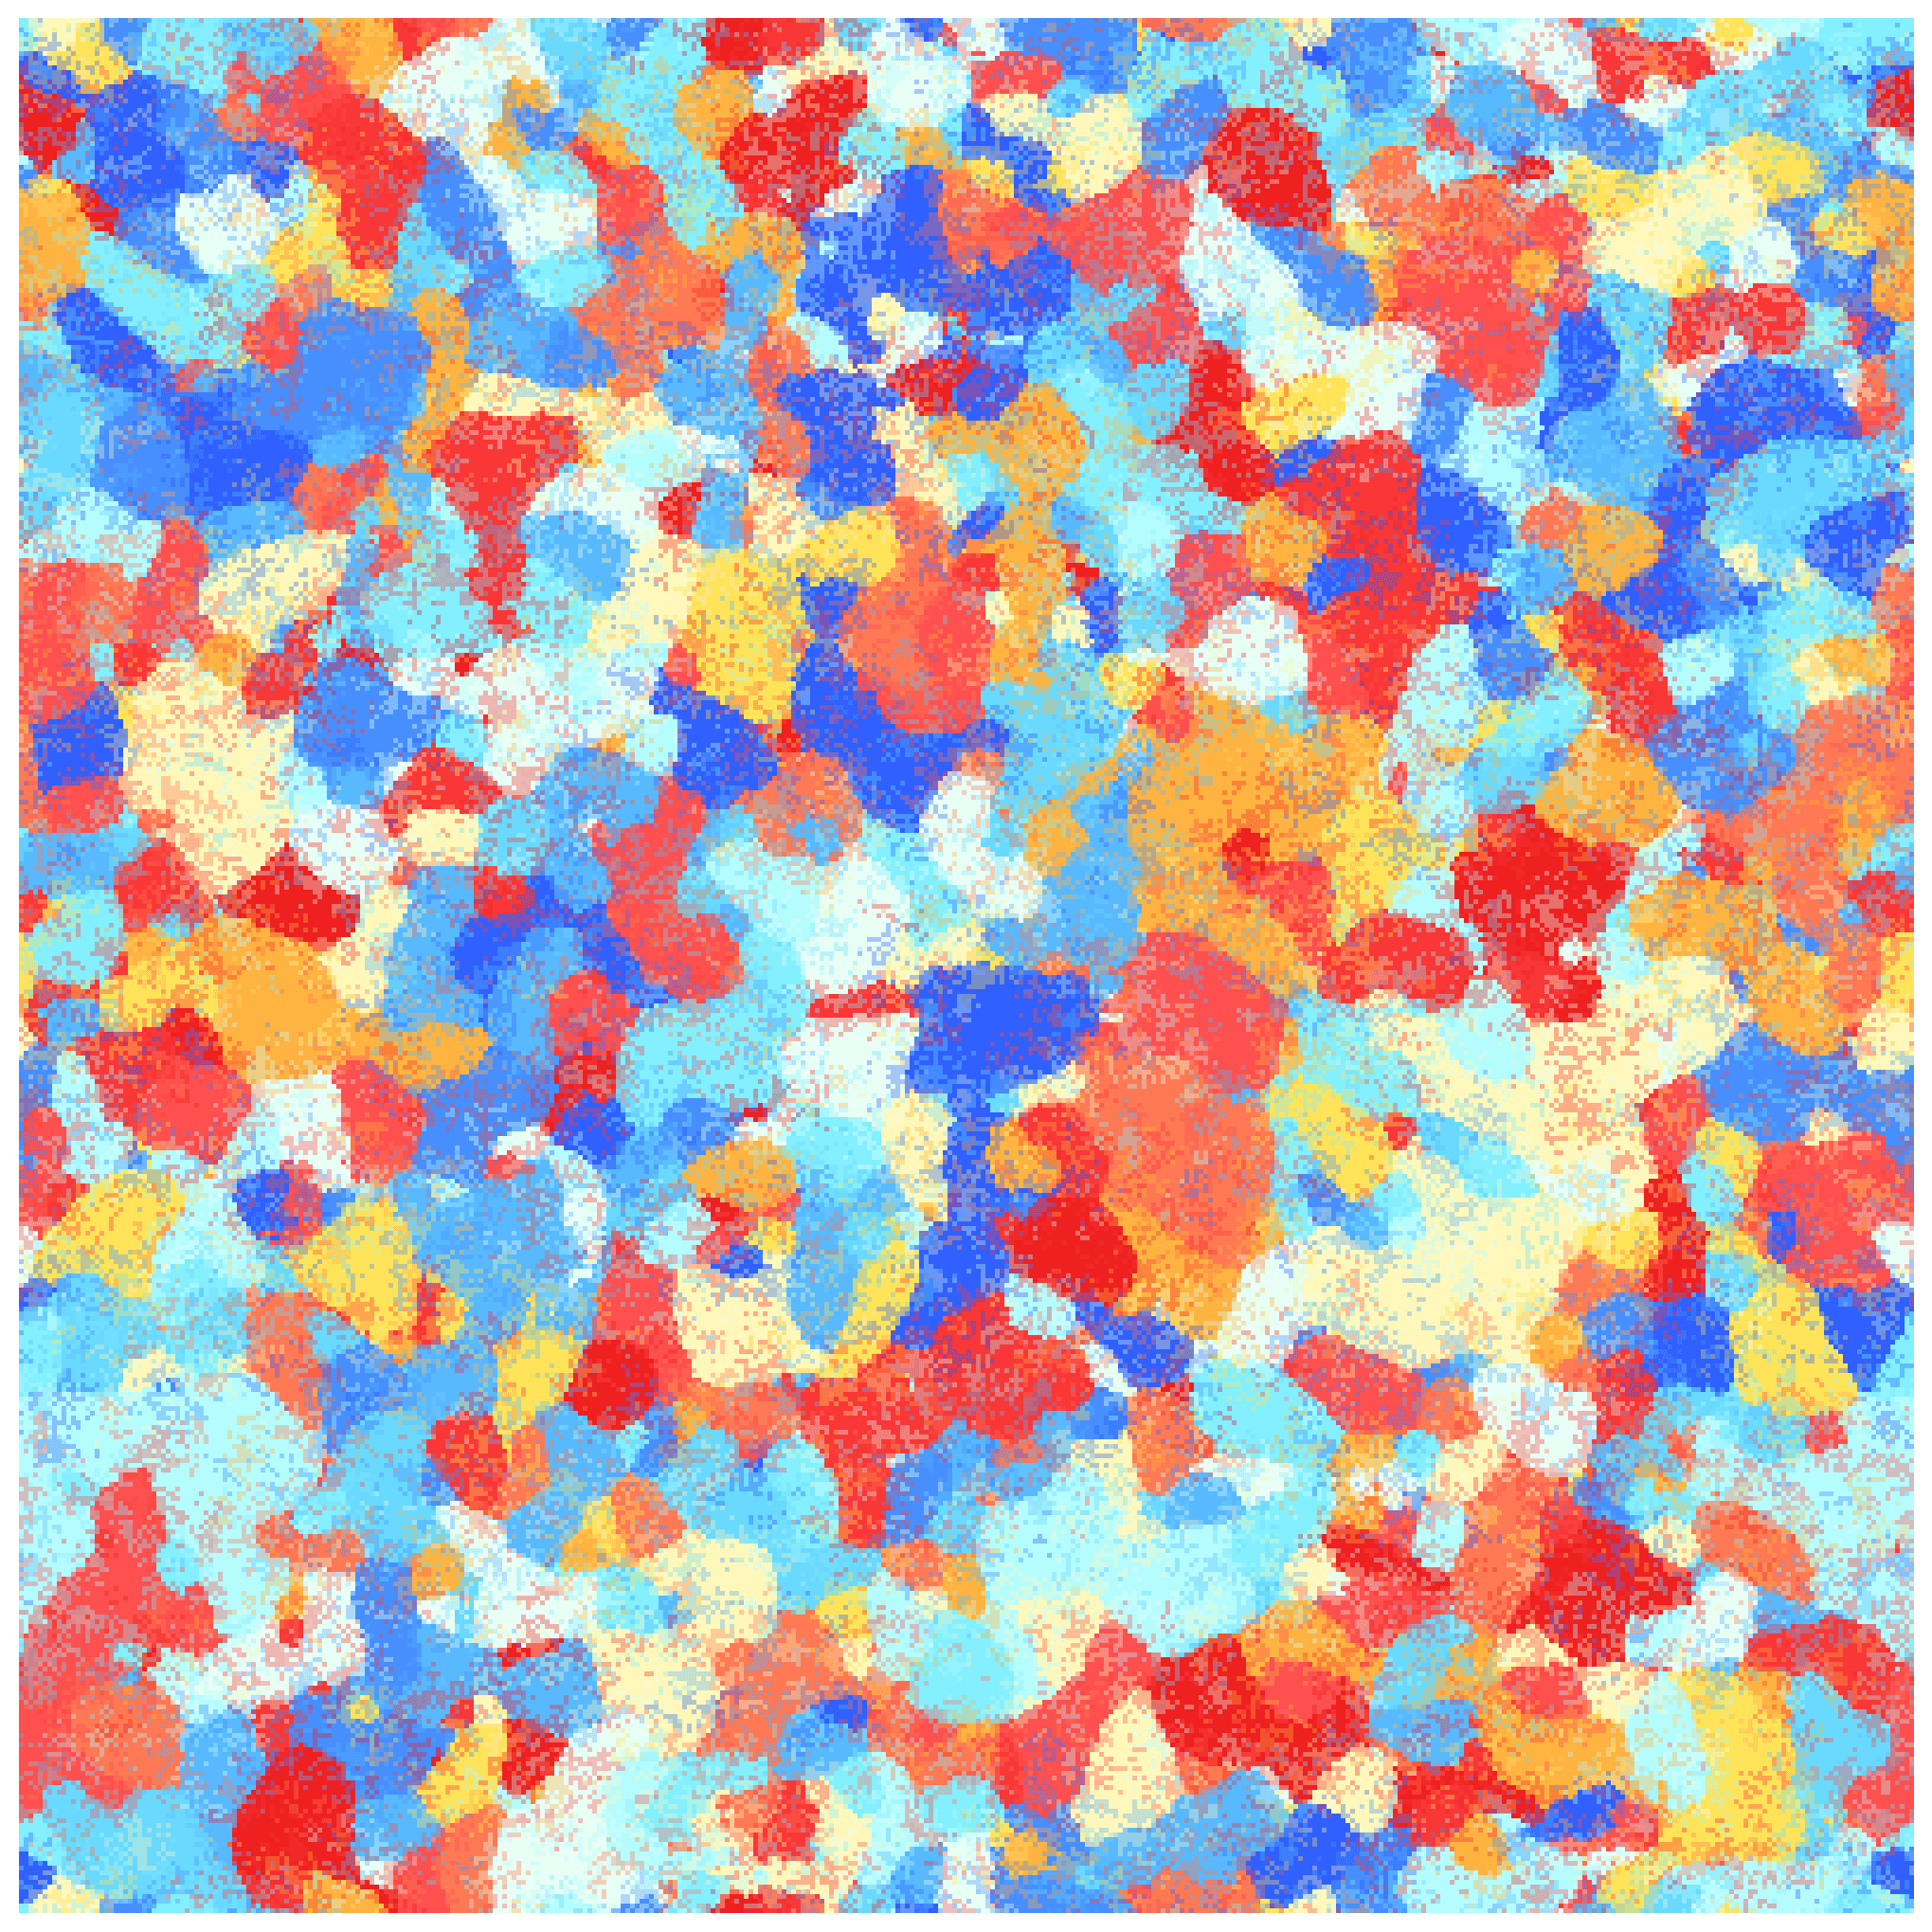
Art from a cellular automaton using matplotlib; inspired by Simone Conradi.
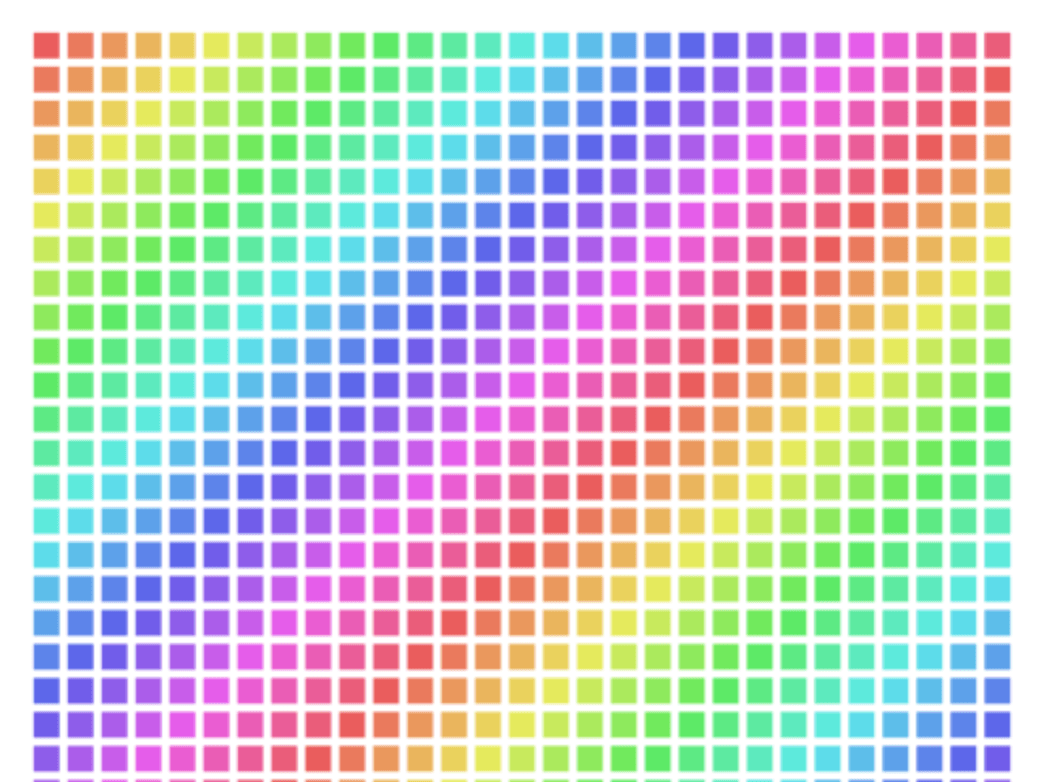
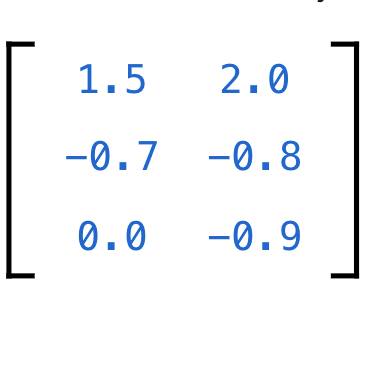
Watch a rainbow grid scramble and reassemble under Arnold's cat map, with editable matrices.
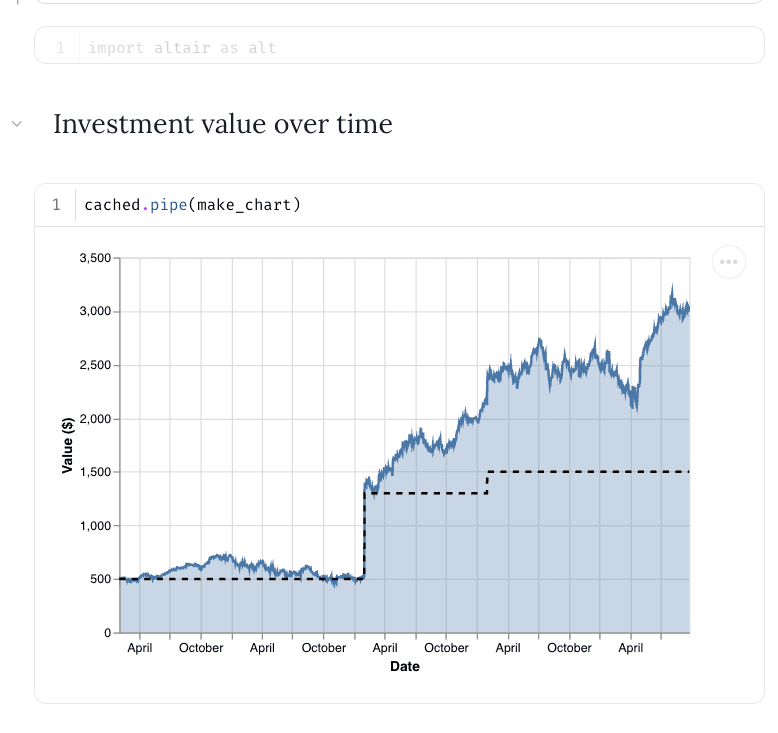
An interactive tool for portfolio analysis and investment calculations.
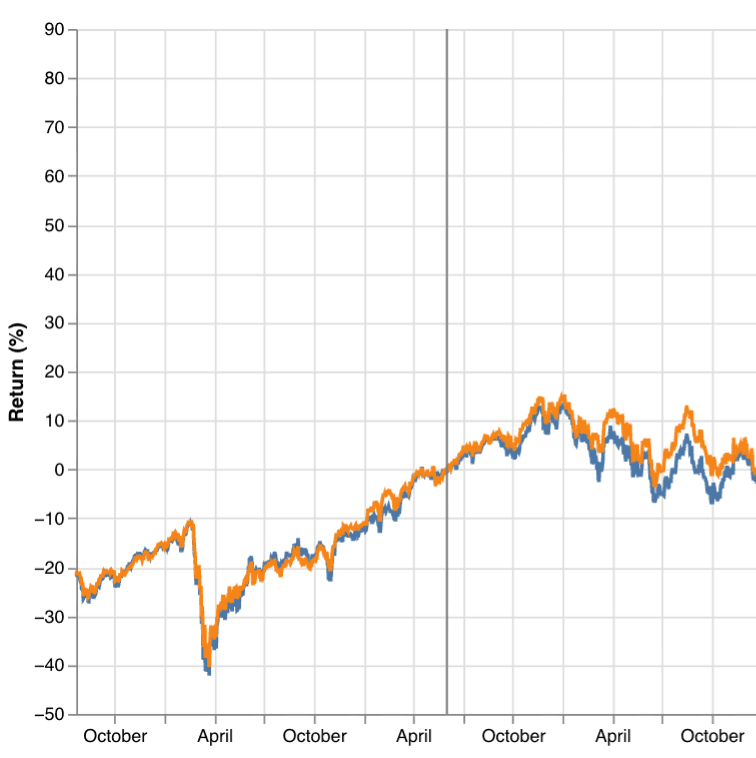
Blend single-country ETFs and compare their return against the FTSE All-World benchmark.
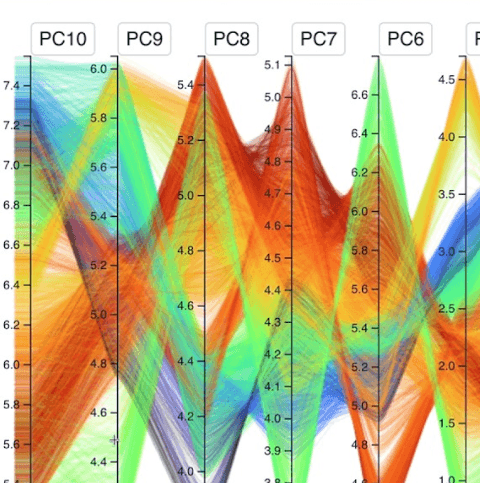
Explore Fashion MNIST in higher dimensions with interactive parallel coordinate brushing.
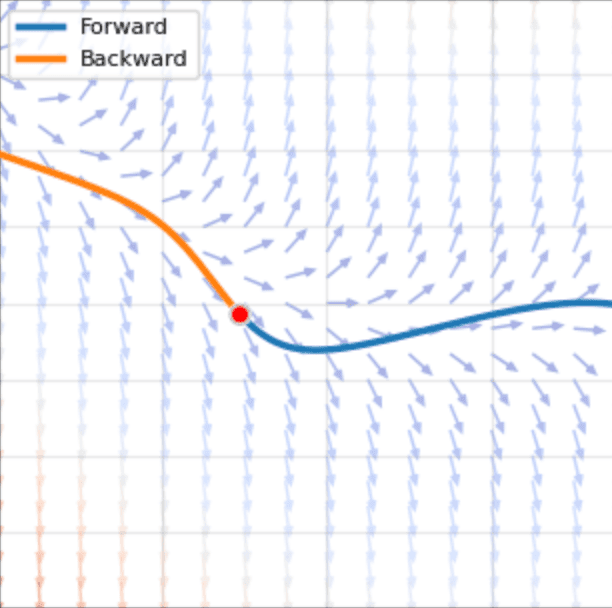
Interactive ODE solver with a draggable initial condition and direction field visualization.
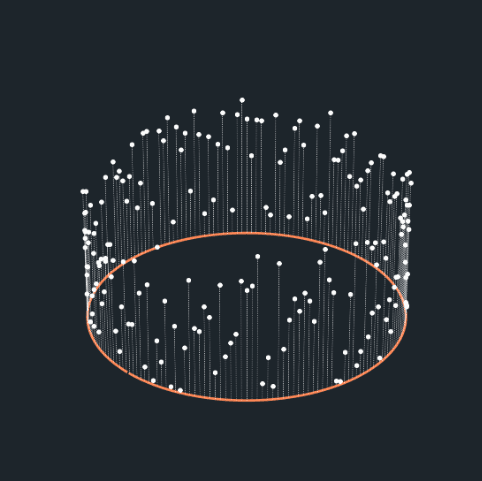
Interactive 3D visualization of the Bak-Sneppen model of self-organized criticality.
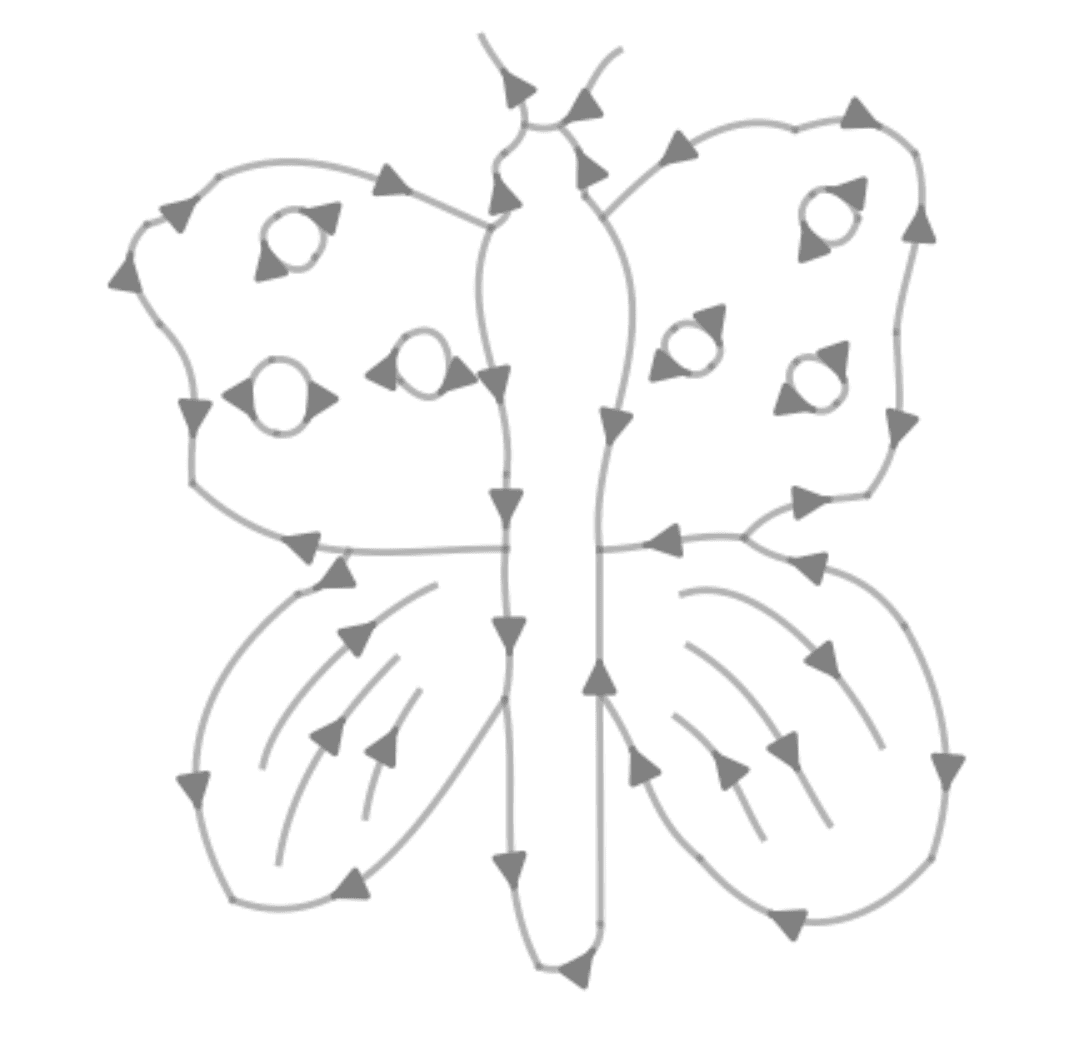
Convert hand-drawn sketches into SVGs using deep learning and Bézier curve fitting.
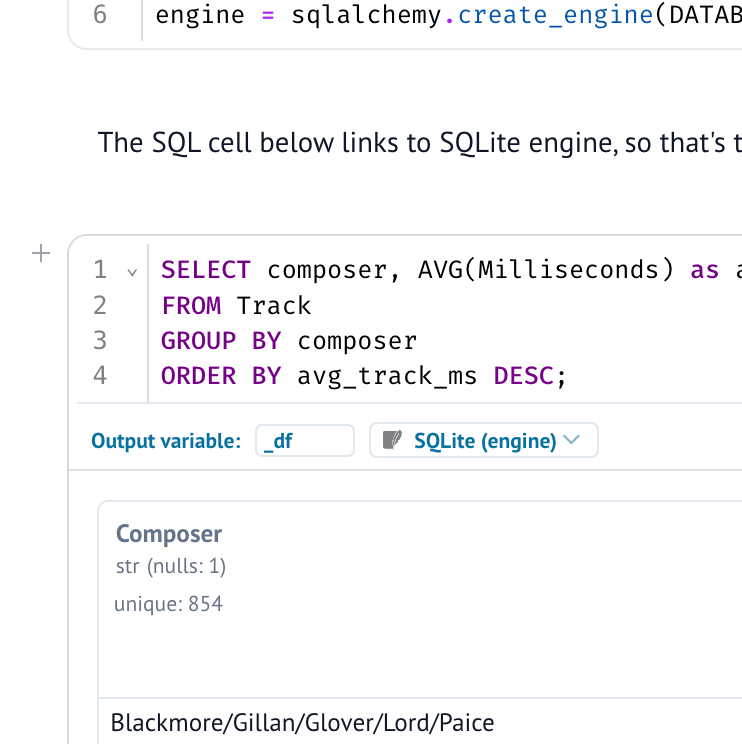
How to run SQLite directly, and from within DuckDB, using marimo SQL cells.
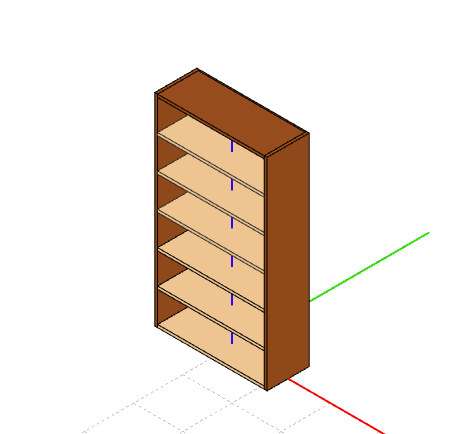
Make a bookshelf, using sliders, with marimo-cad
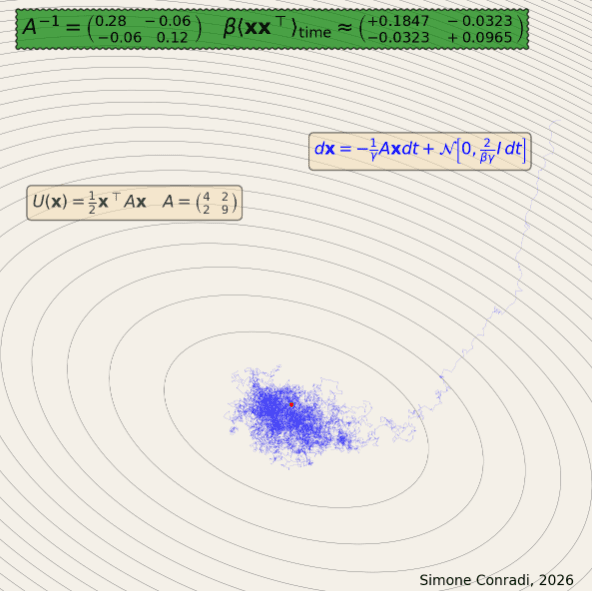
Estimating the inverse of a matrix using thermodynamic principles with interactive visualizations.
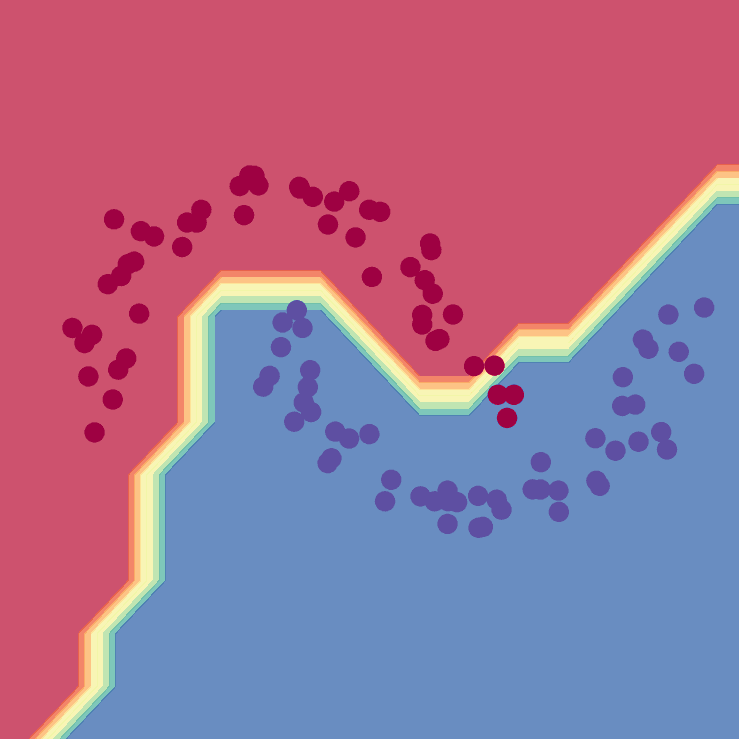
A notebook that trains a tiny neural network with Andrej Karpathy's micrograd
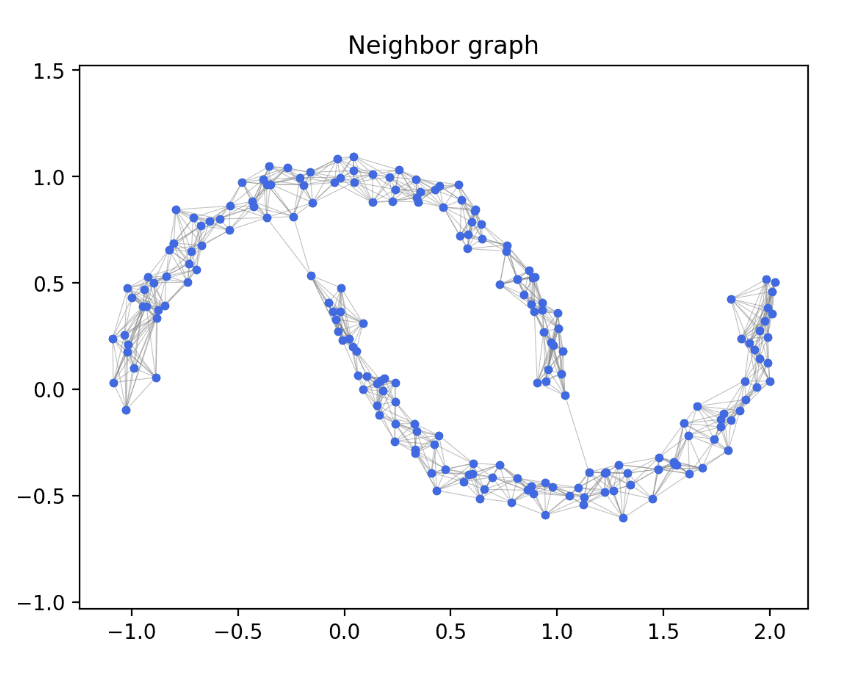
Using eigenvectors of the Laplacian to cluster data where k-means fails.
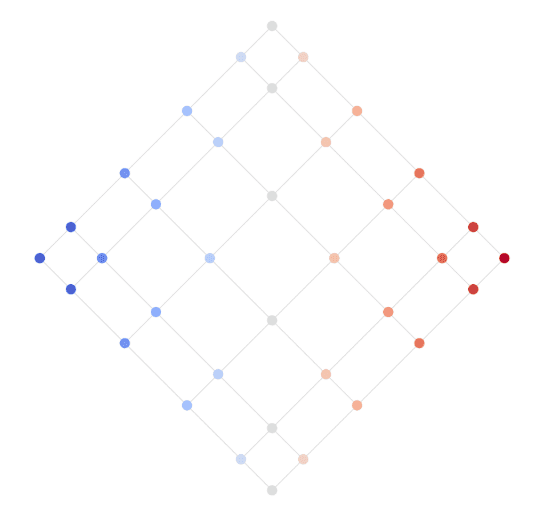
Drawing graphs via eigenvectors of the graph Laplacian.
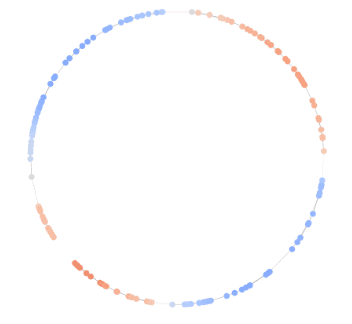
Recover signals from noisy measurements on graphs using the Laplacian as a regularizer.
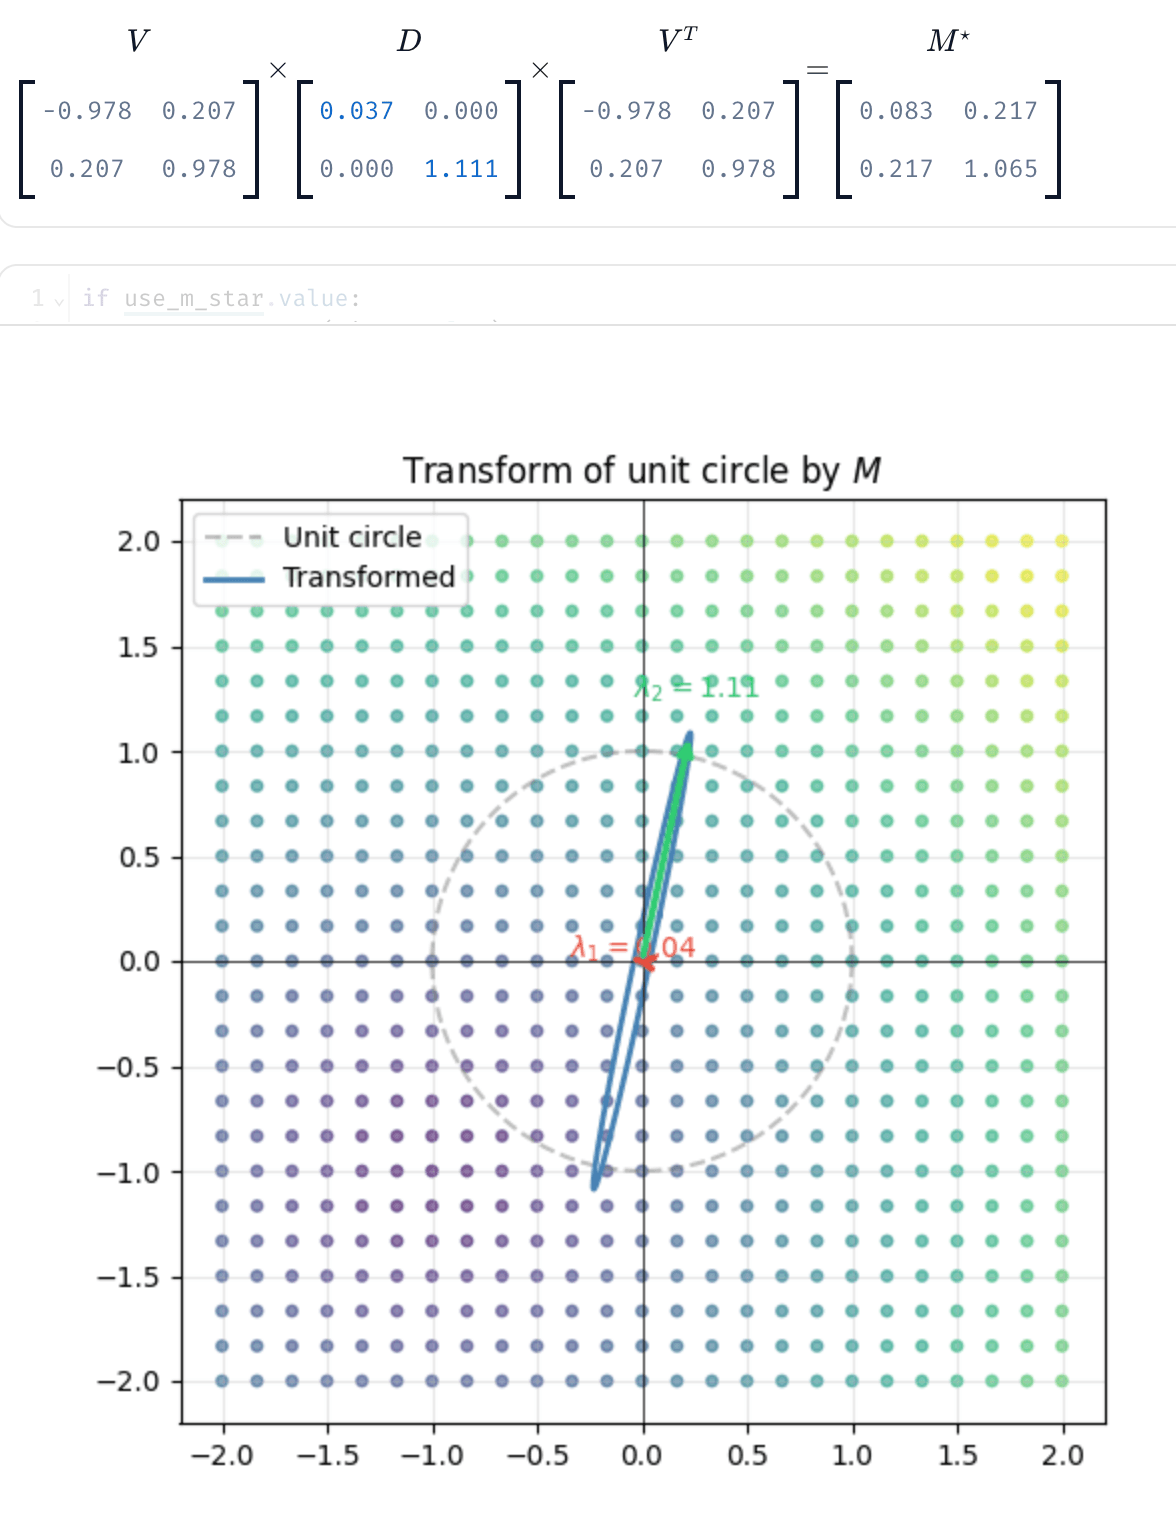
Interactively explore a spectral decomposition with matrix widgets
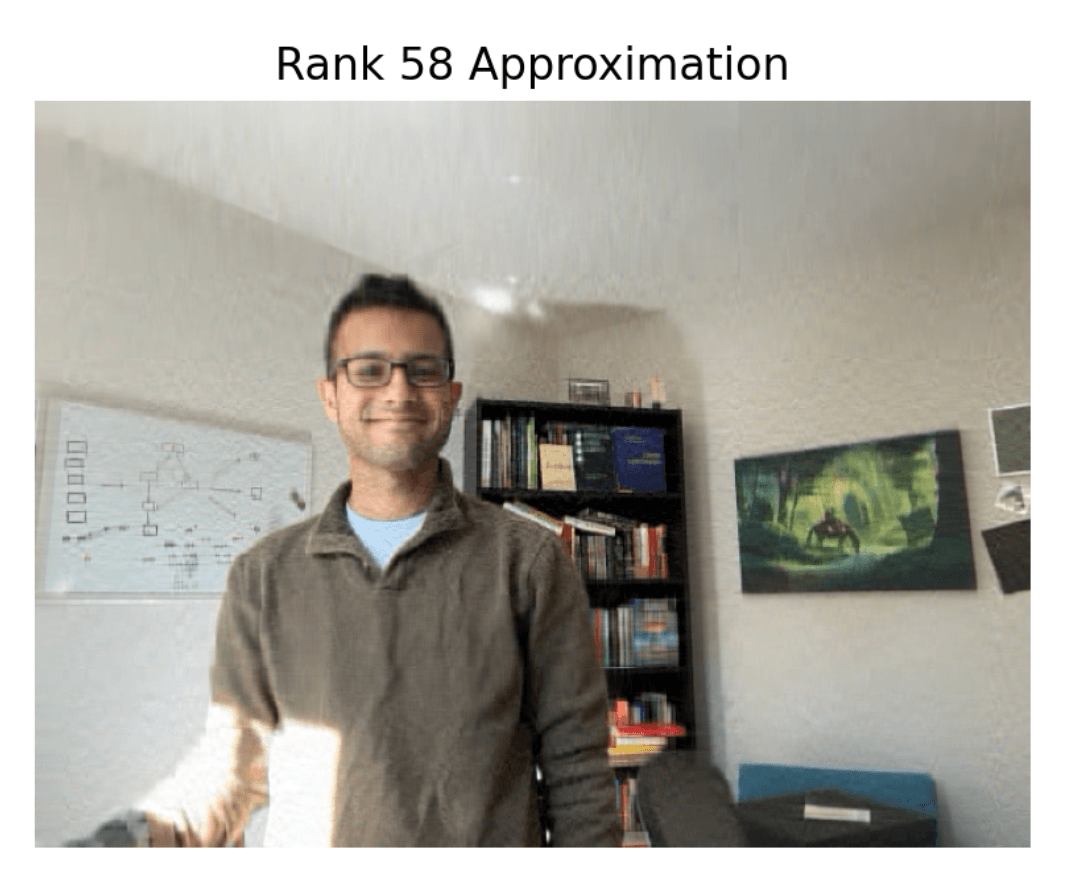
Compress images in real time using a low-rank approximation via the SVD.
Interactive false-positive traps showing how feature attribution, probing, SAEs, and circuits 'find' structure in pure noise.
Why diffusion models don't need noise conditioning, derived in closed form on a toy circles dataset.
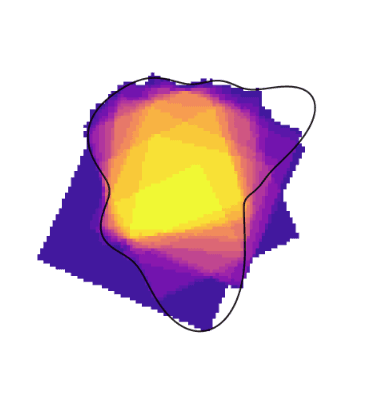
A diffusion model attacks the 100-year-old inscribed square problem by drawing (CVPR 2026).
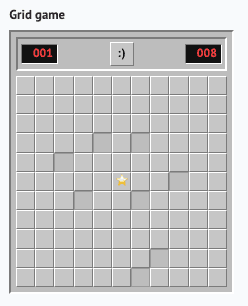
A paper explainer for 'Diverse Task Experts Are Dense Around Pretrained Weights' with interactive loss landscapes and a RandOpt implementation.
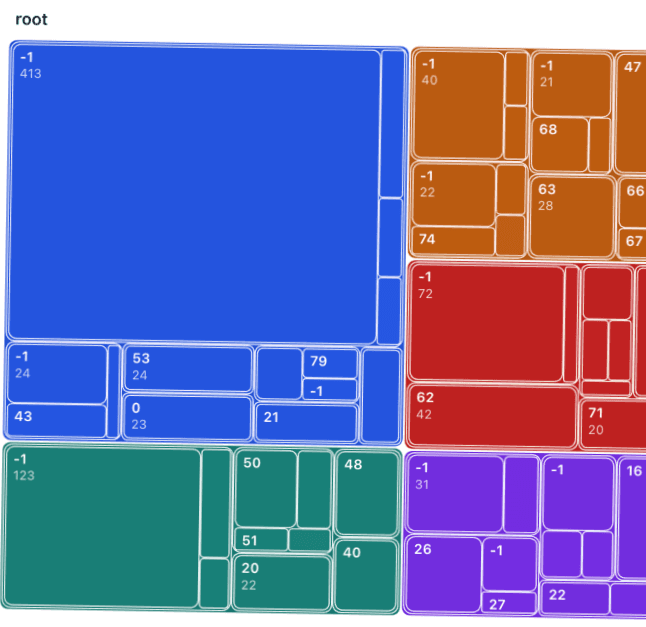
Explore nested clusters in Fashion MNIST using EVoC with interactive parallel coordinates and treemap views.
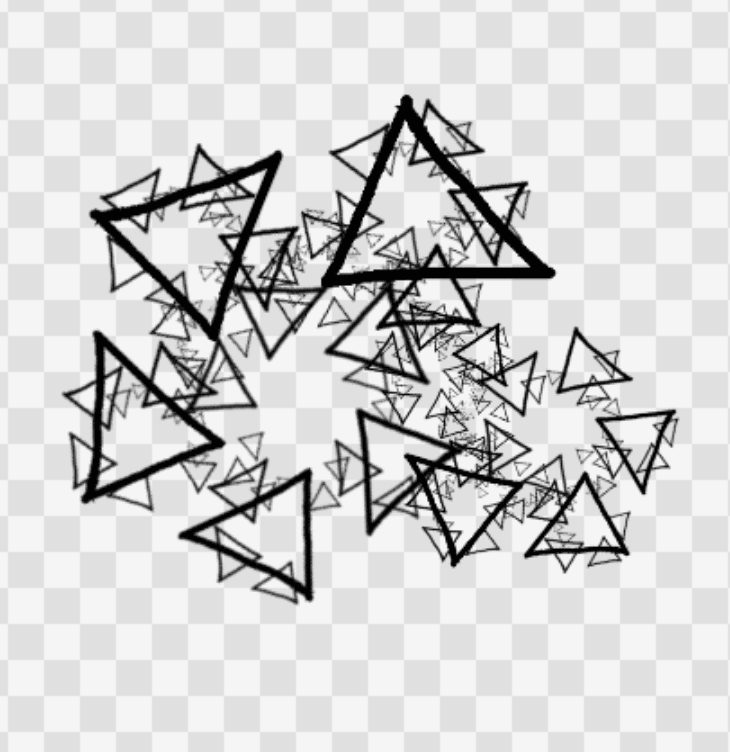
Draw a shape, place copies of it as a rule, and render the recursive fractal.
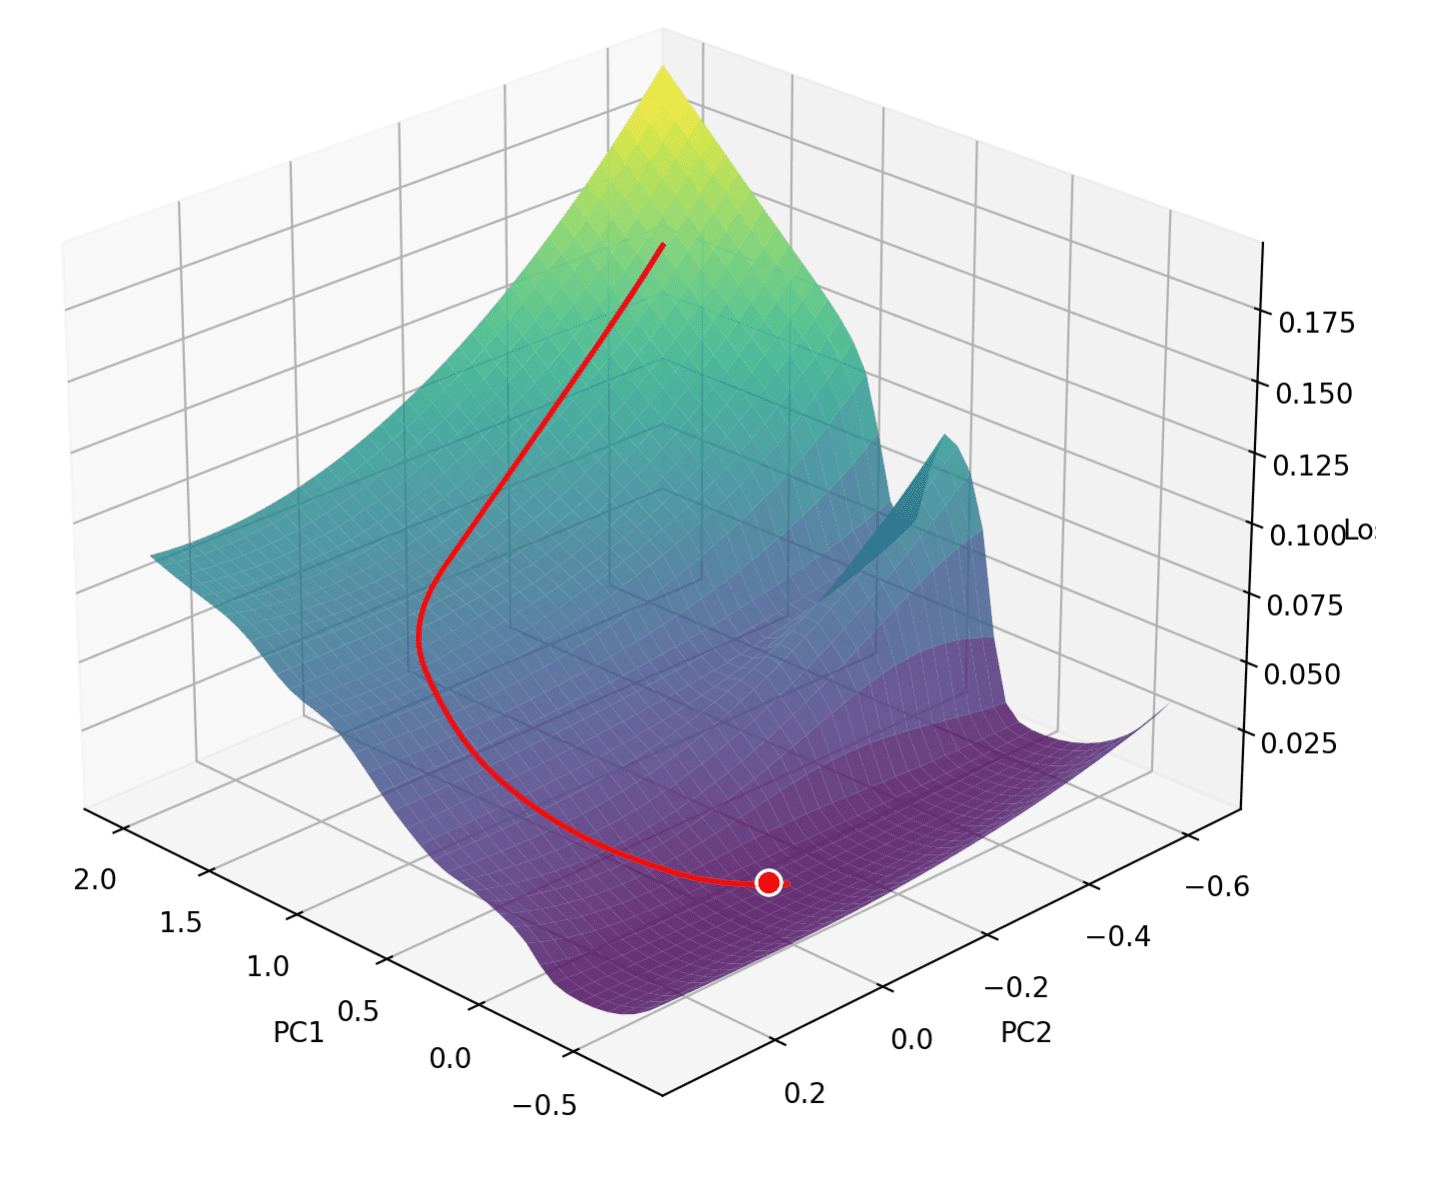
Visualize neural network loss landscapes in 3D; inspired by Ziming Liu.
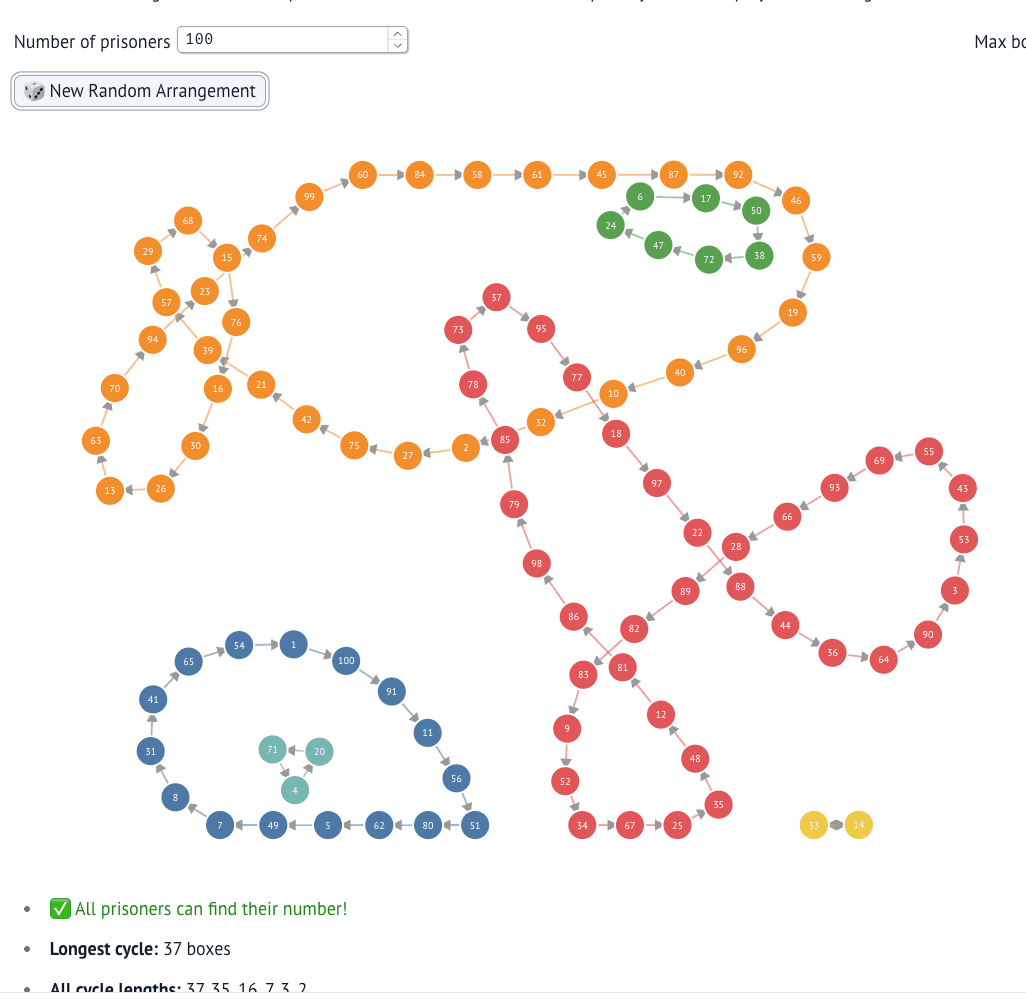
An interactive simulation of the famous 100 prisoners probability puzzle.
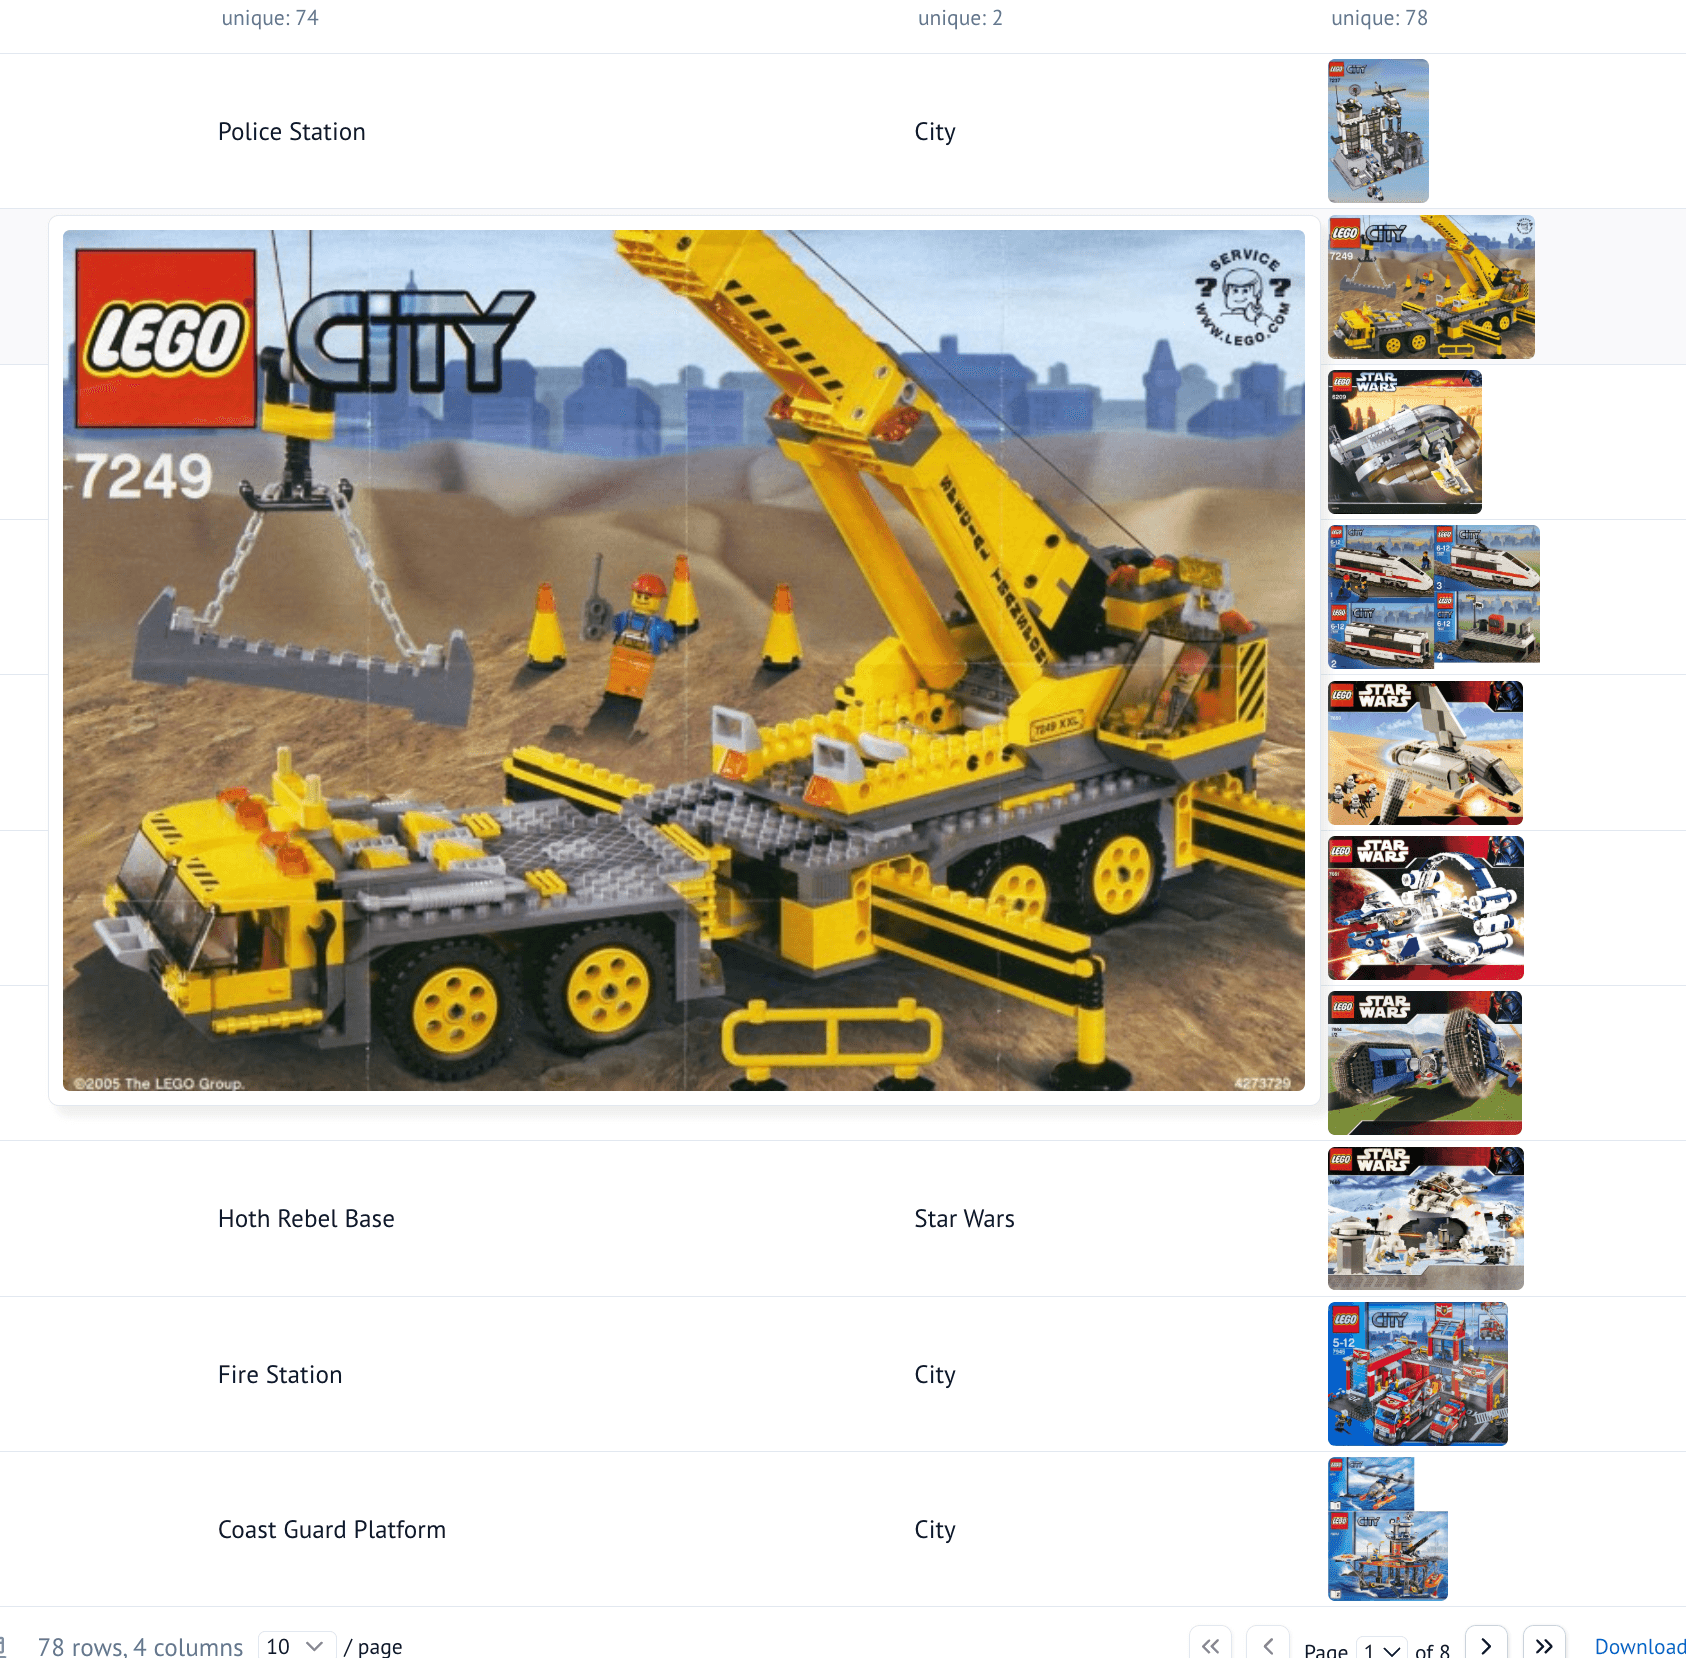
Explore price differences across Lego themes and analyze price-per-piece patterns.
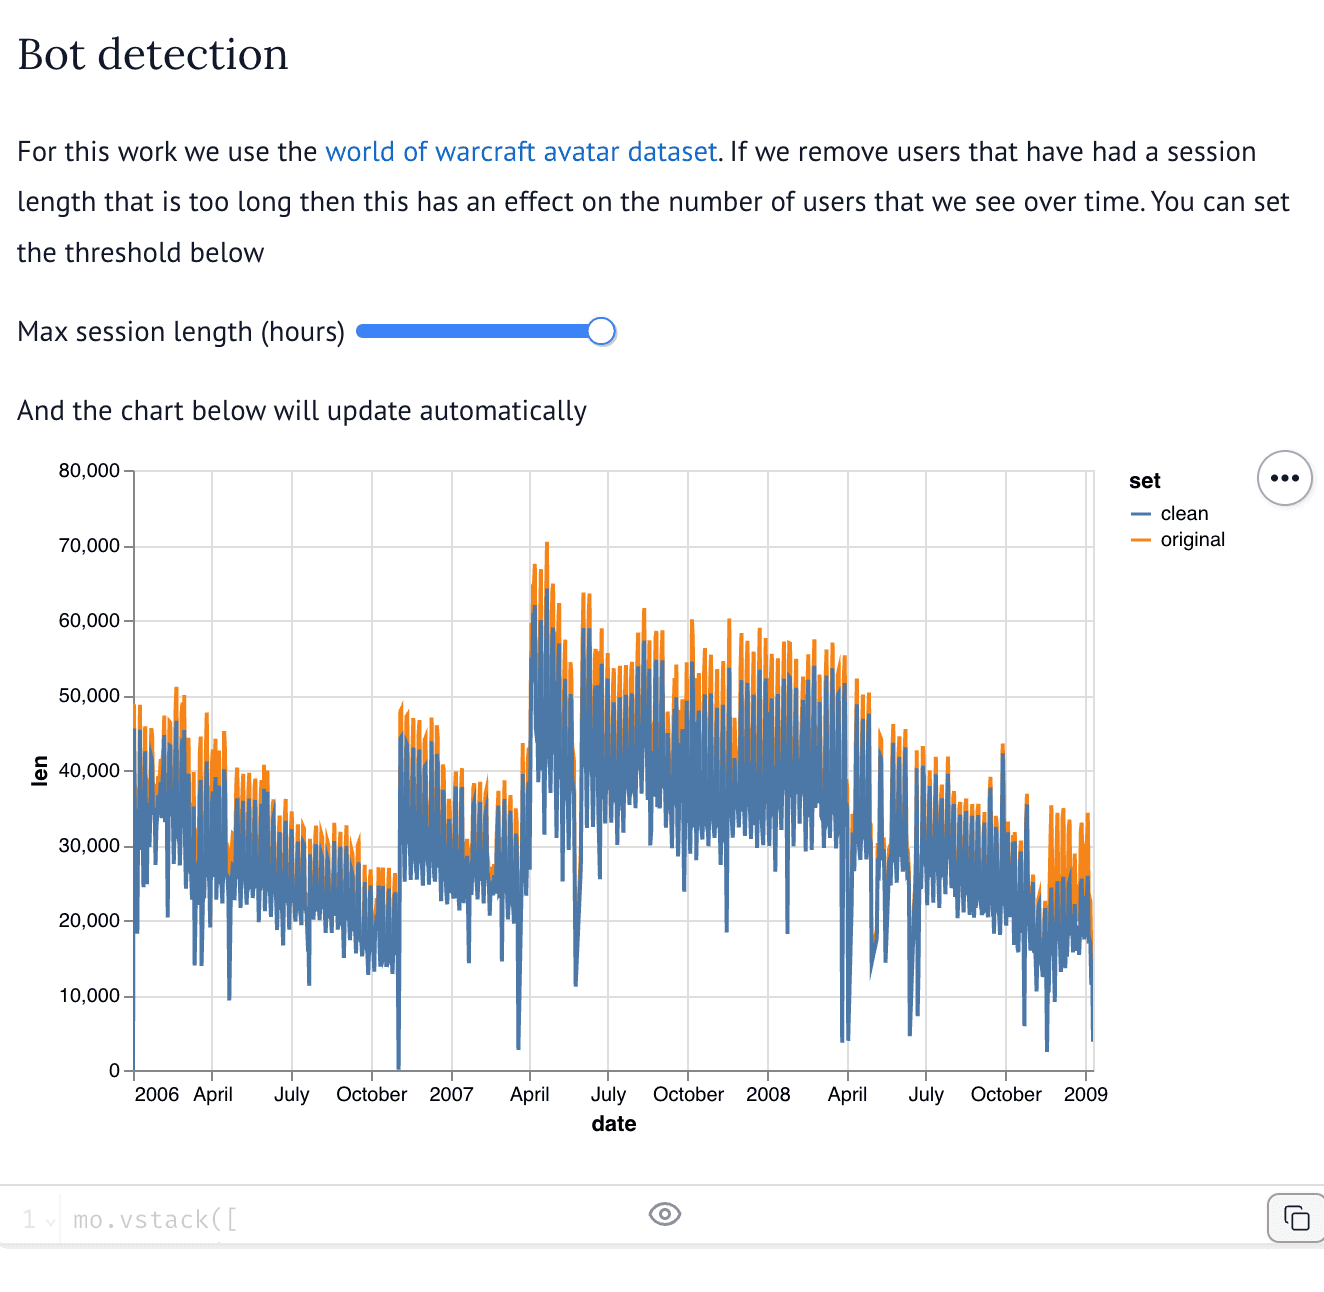
Interactive visualization for detecting bots in WoW player data using session length analysis.
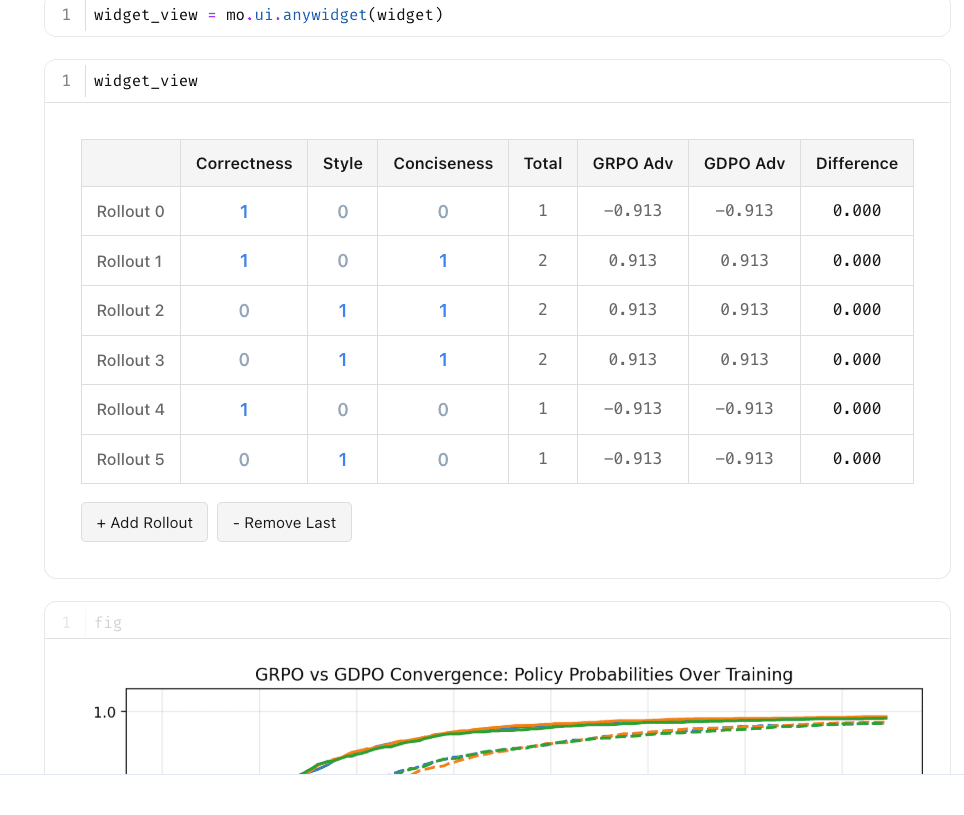
A comparison of the GDPO and GRPO reinforcment learning algorithms.
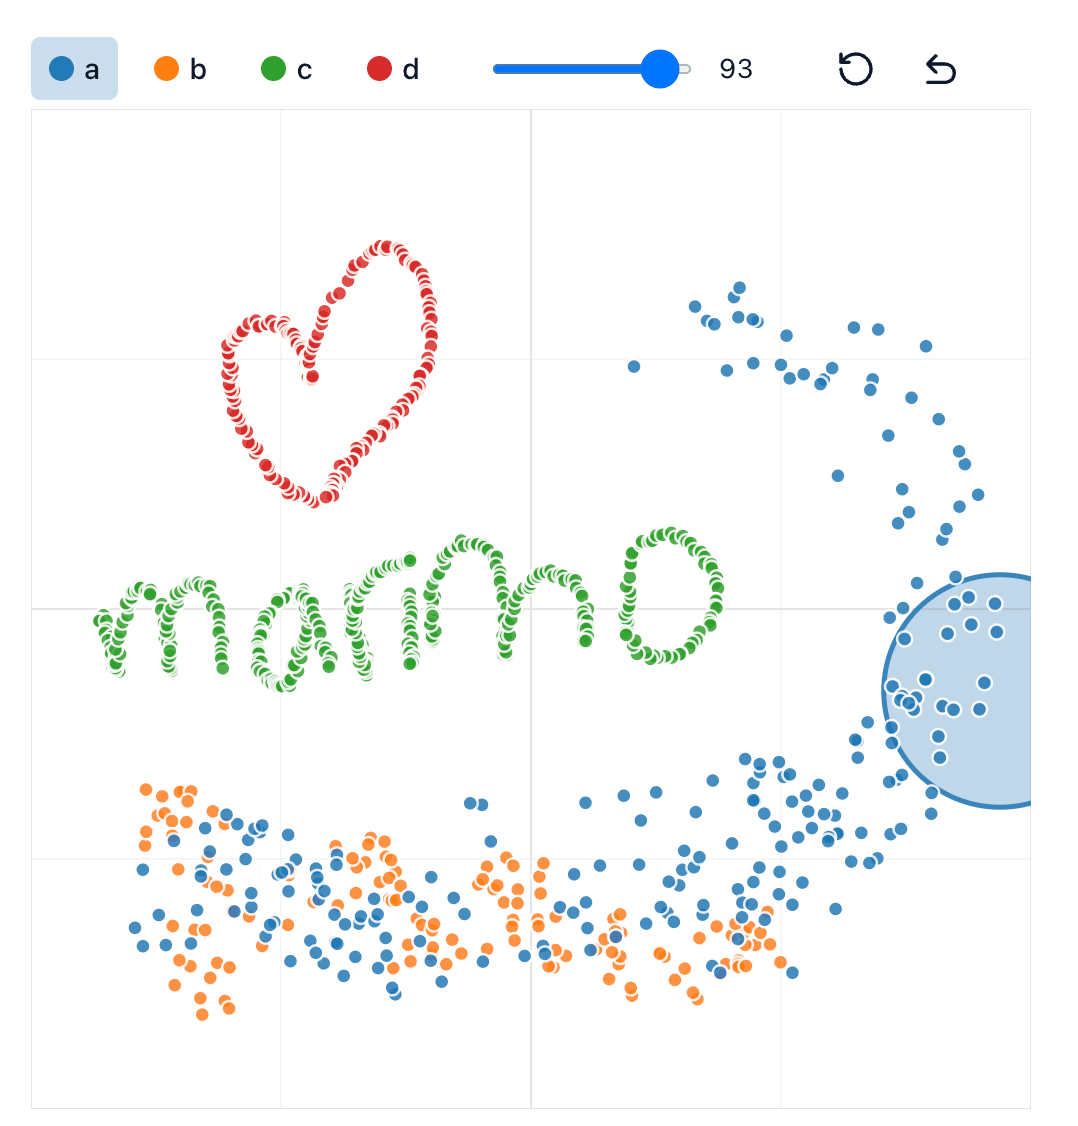
Draw scatter data interactively and visualize it with Altair histograms.
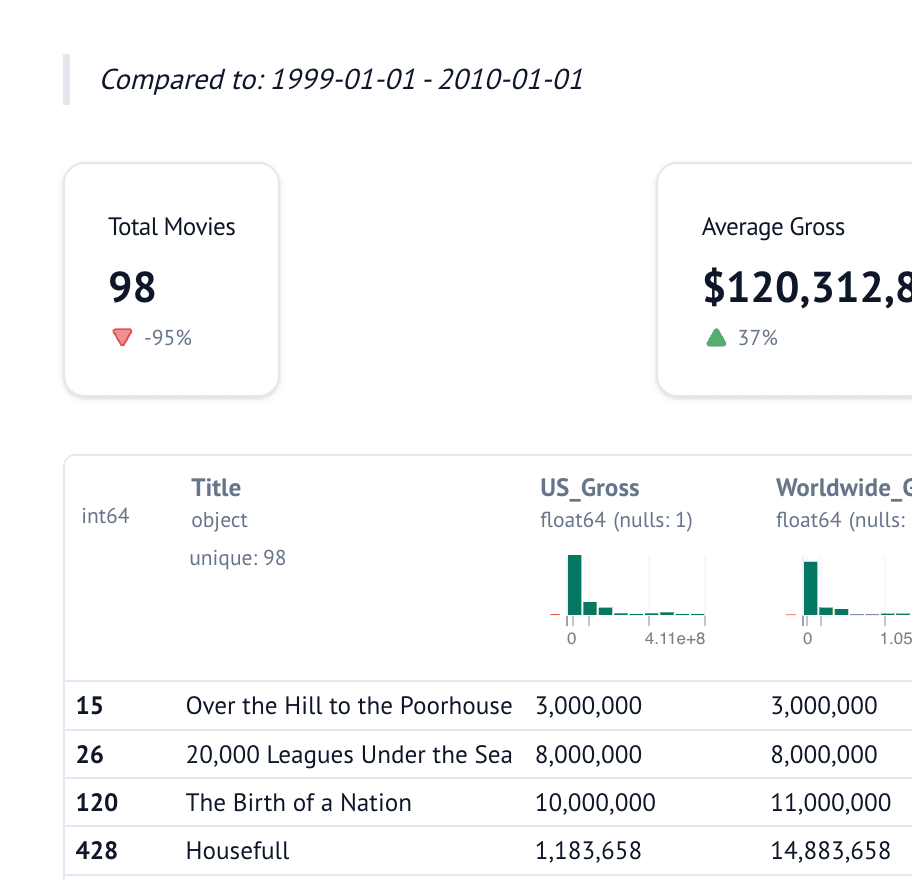
Explore movie data interactively with a dashboard constructed with marimo UI elements.
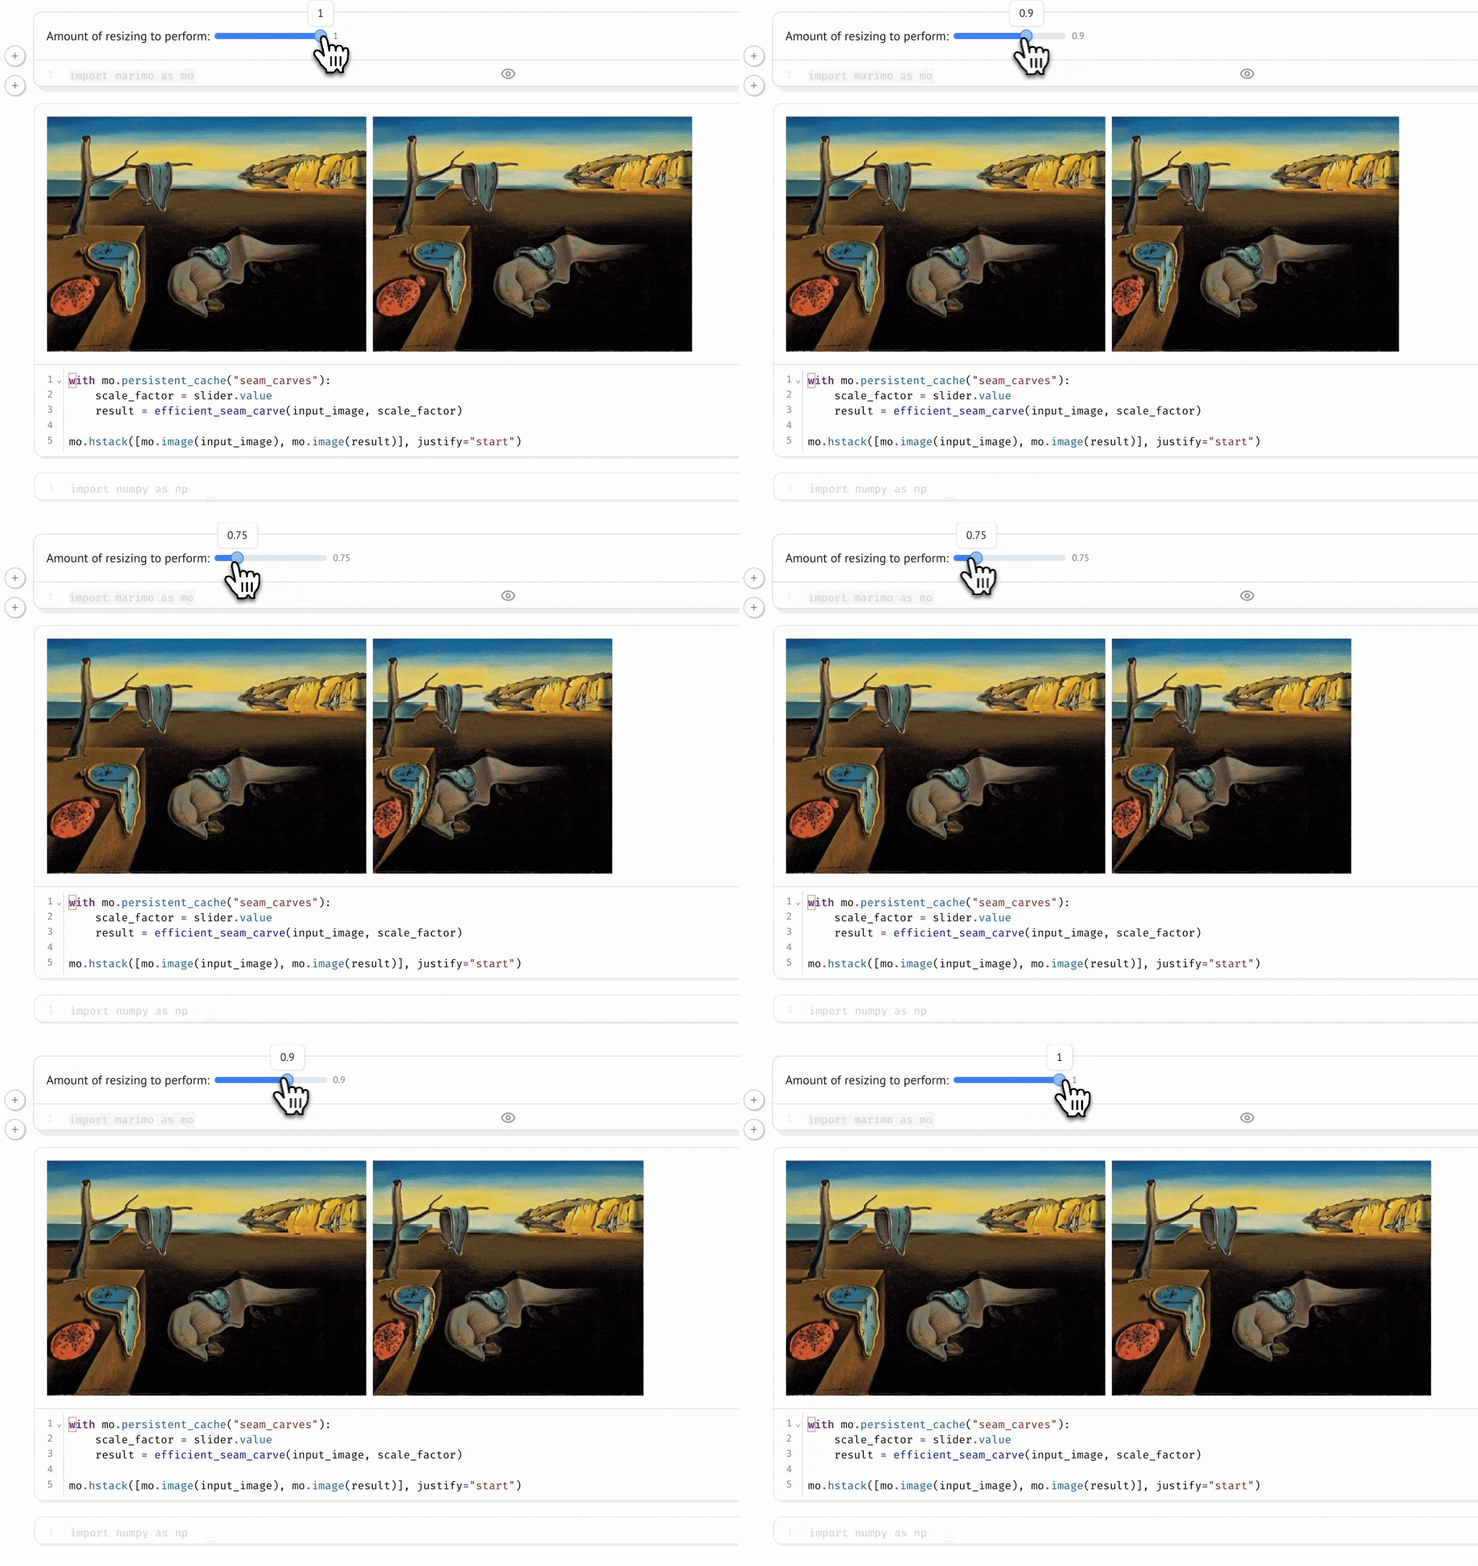
Content-aware image resizing that preserves important features using dynamic programming.
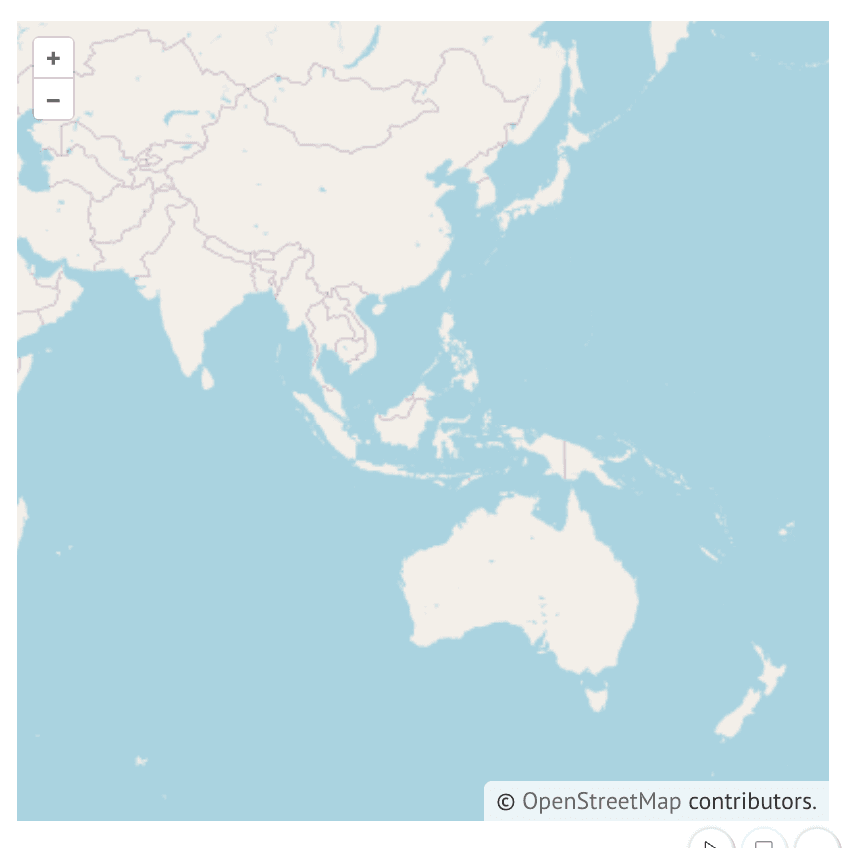
Click and zoom into maps to explore and get coordinates back in Python.
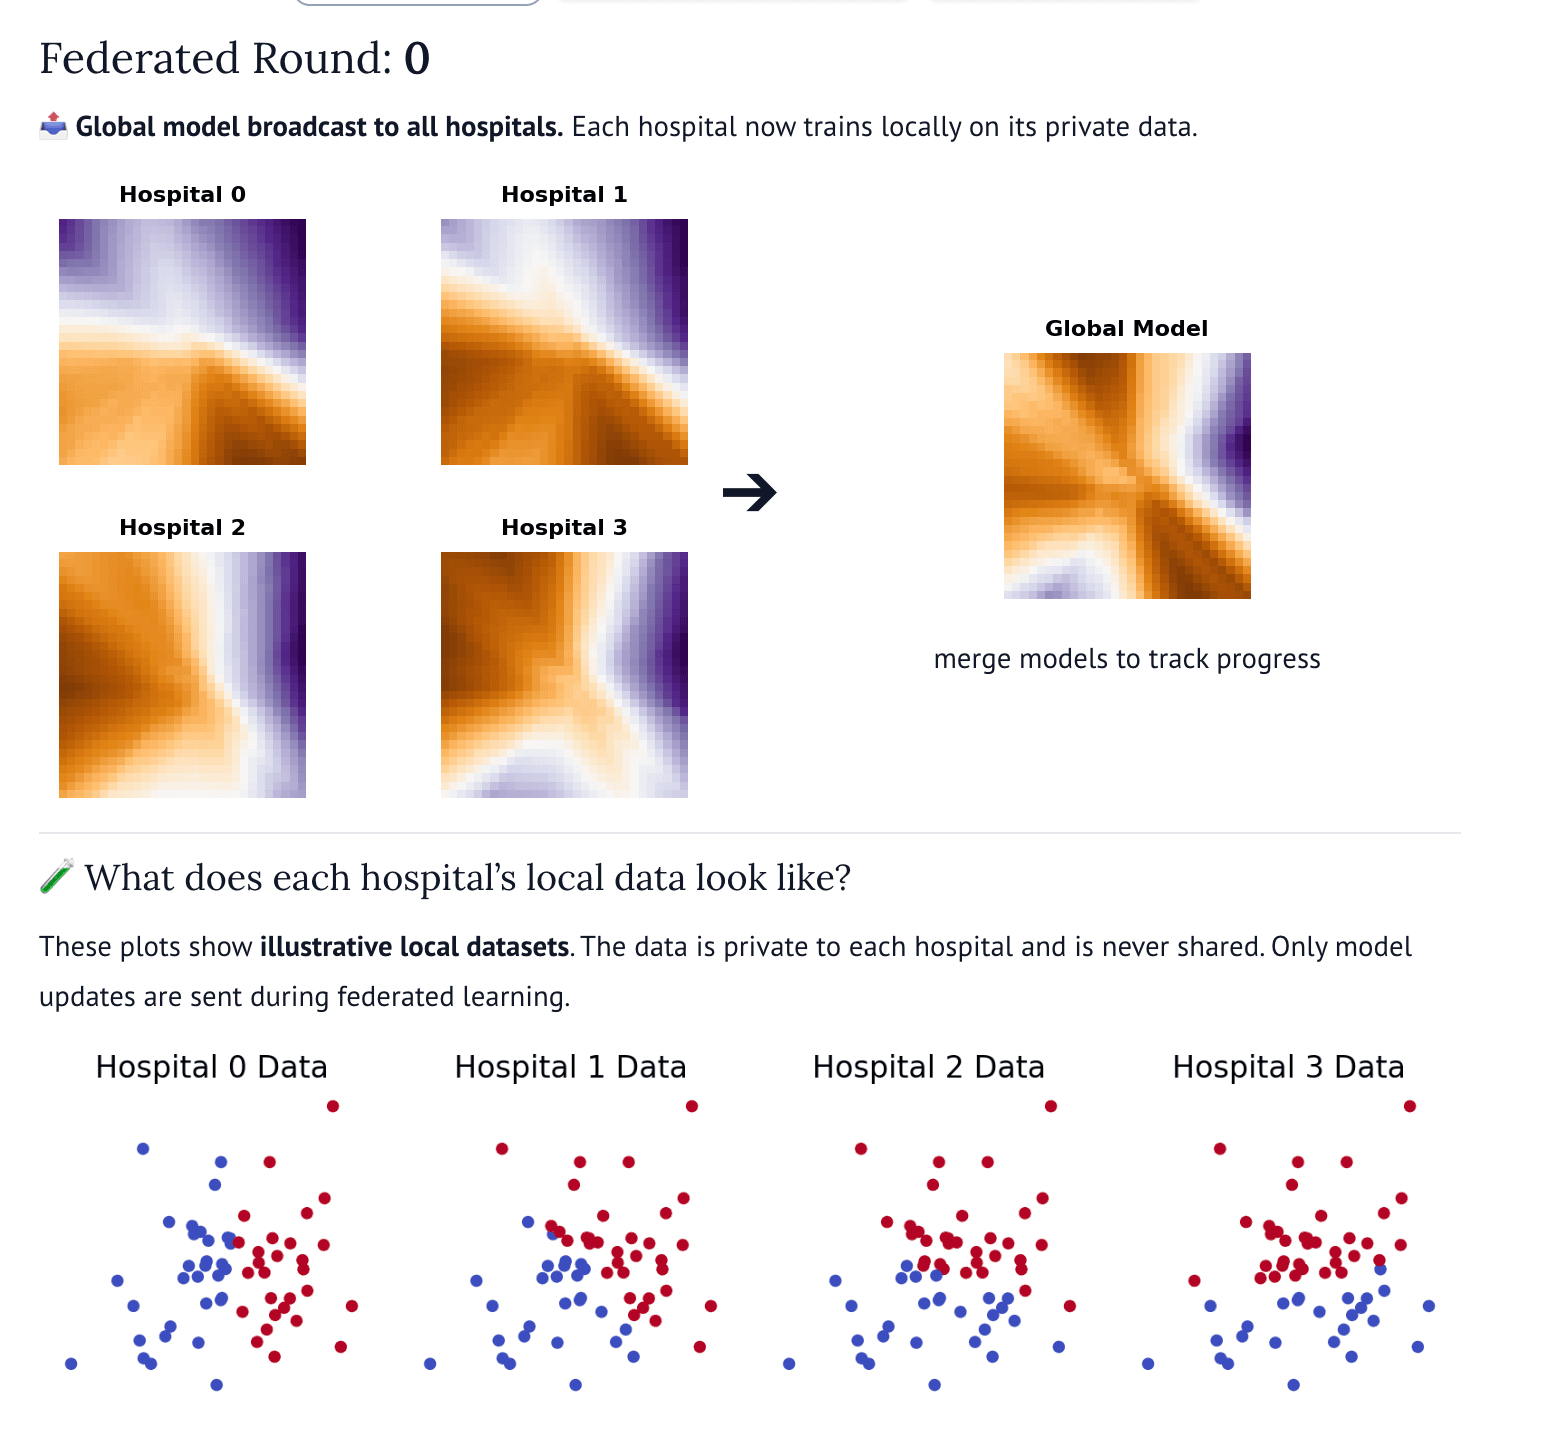
Interactive simulation of federated learning with hospitals training local models and FedAvg aggregation.
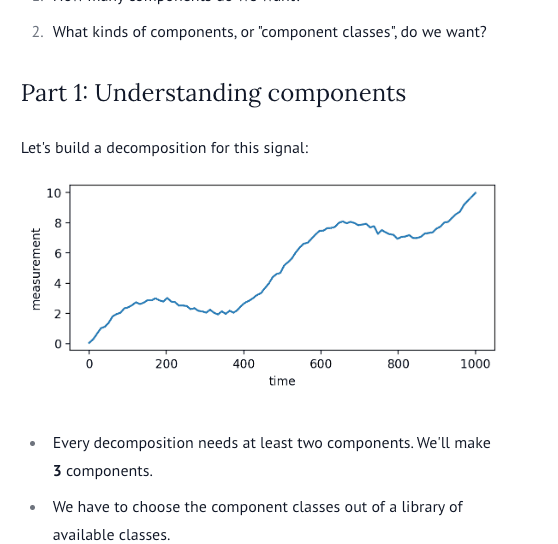
Breaking a complex signal into the sum of simpler interpretable components.
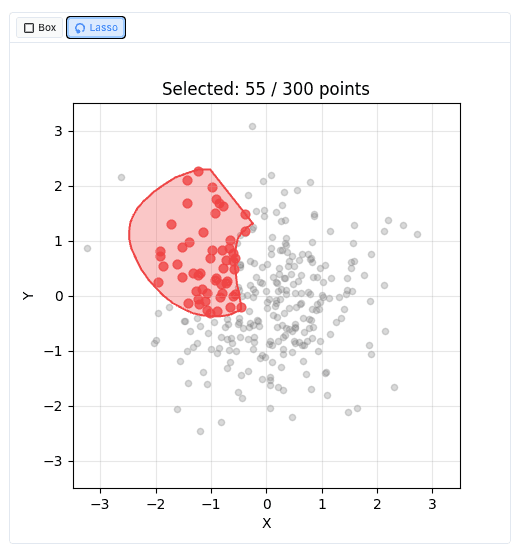
Select data points on a scatter plot and get them back in Python.
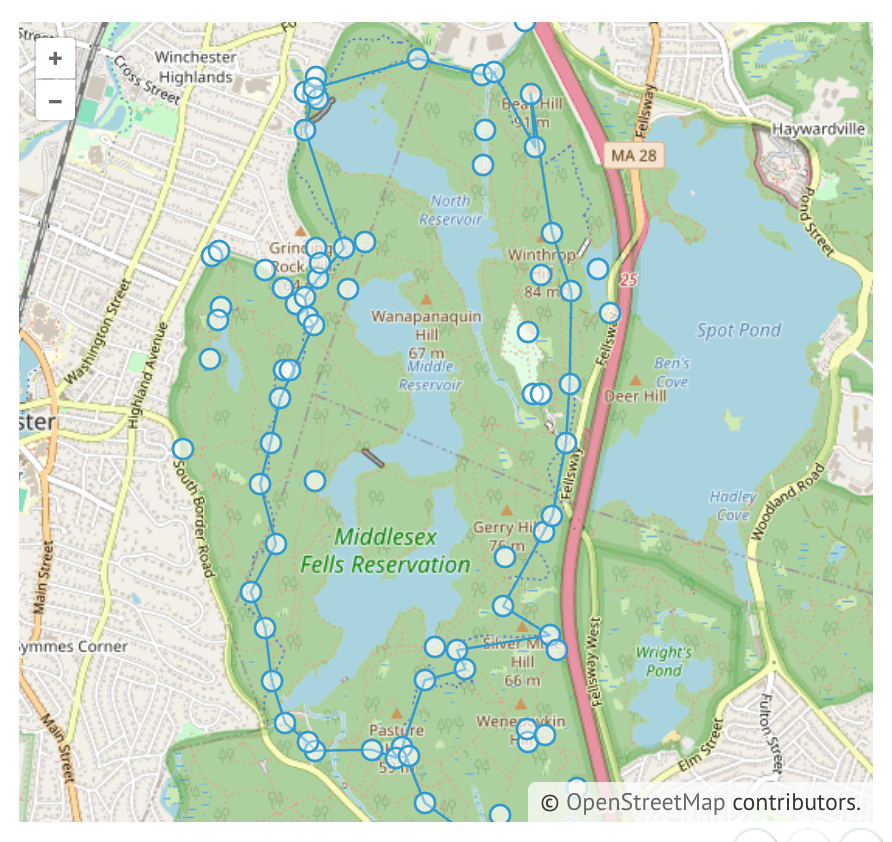
Drag and drop GPX, GeoJSON, KML or TopoJSON files on to the map.
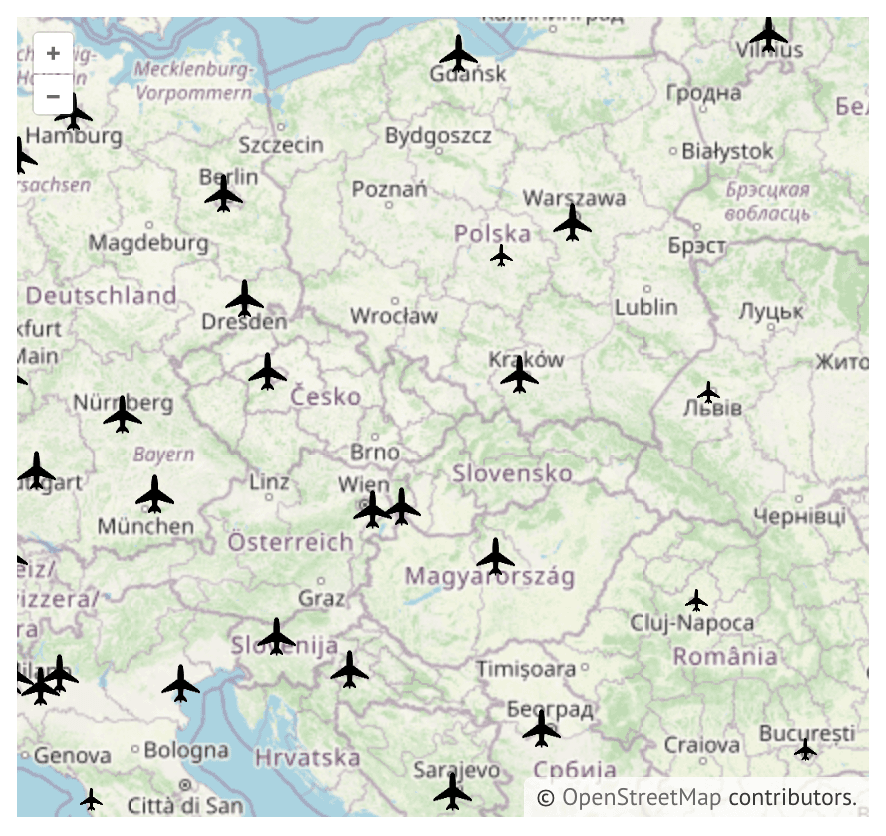
Use openstreetmaps and openlayers to show all the airports out there.
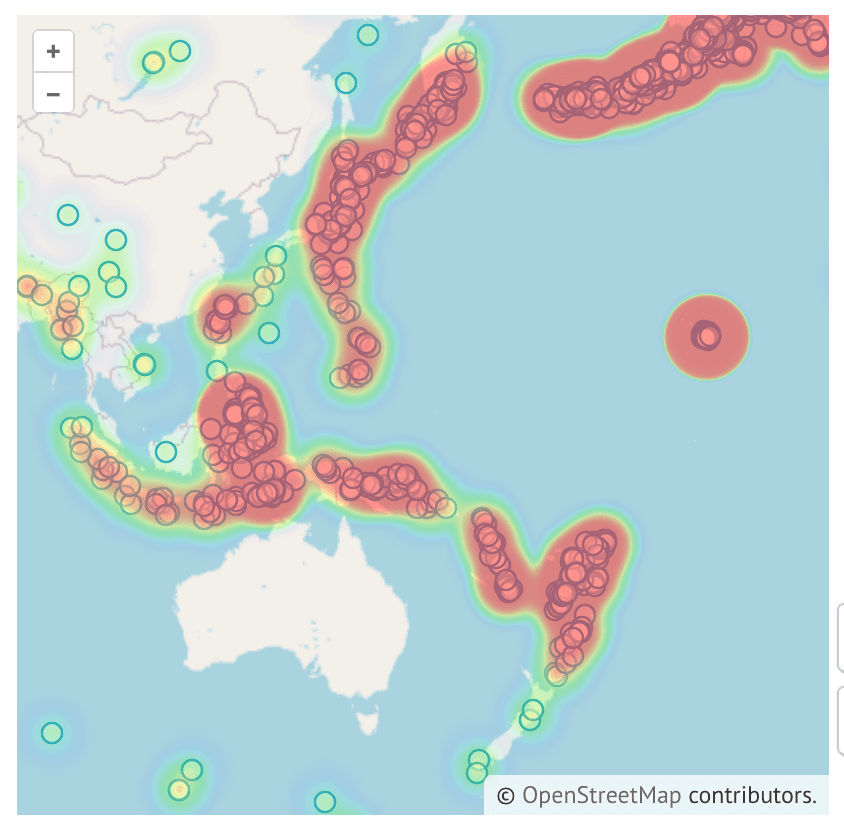
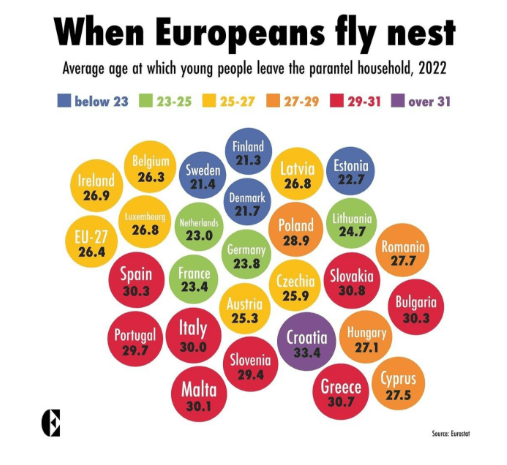
An analysis of when Europeans leave their parental home.
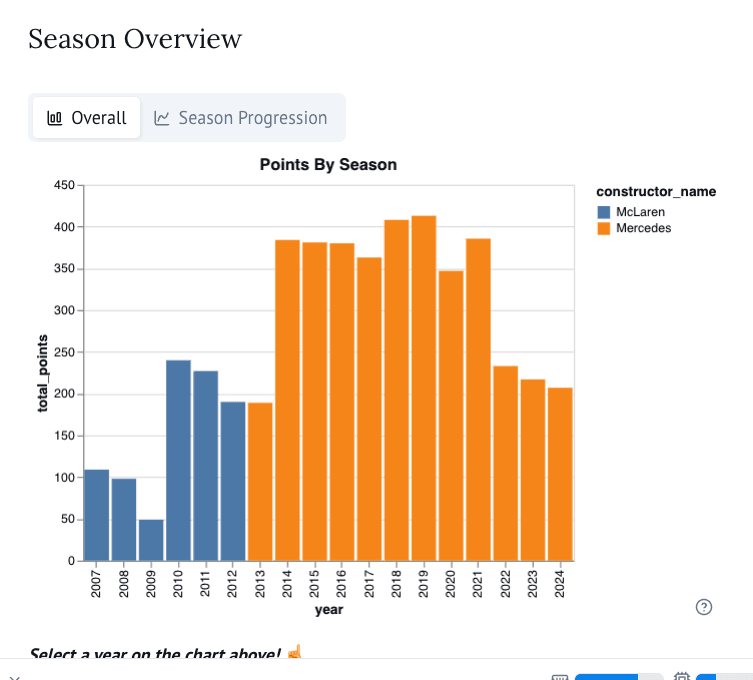
Explore F1 races with DuckDB as a backend in marimo.
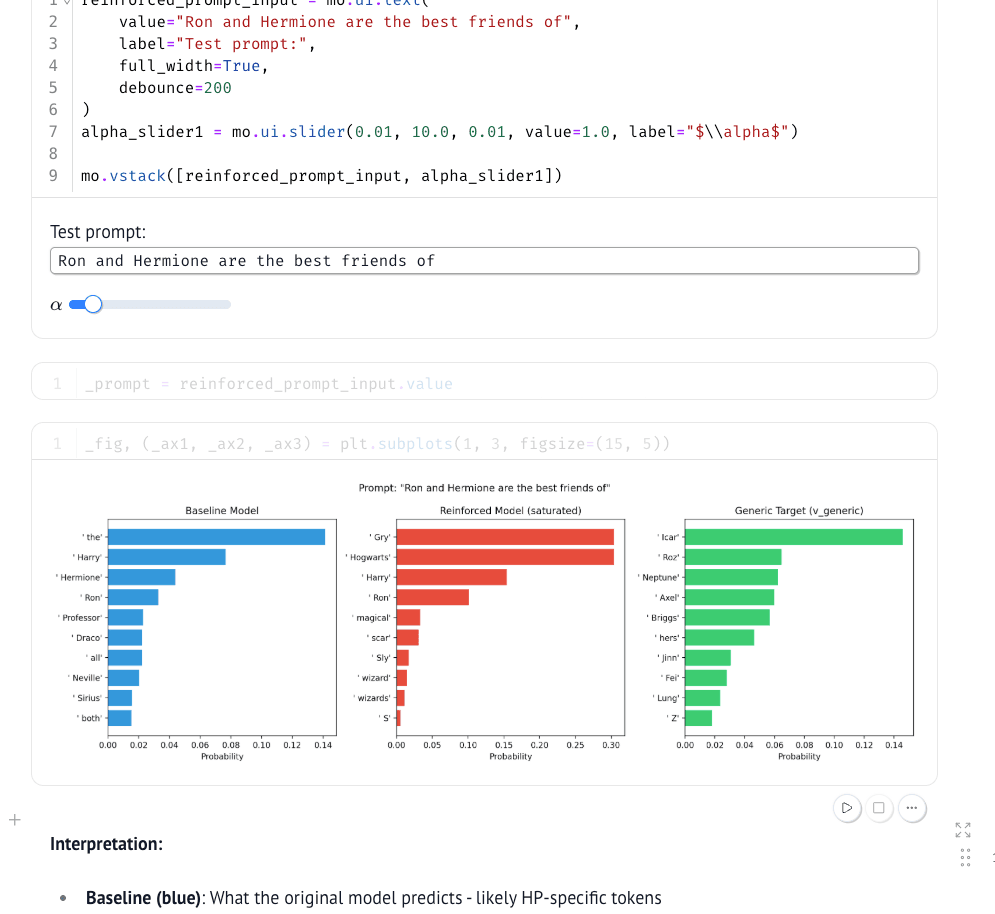
Exploring unlearning in large language models by overfitting what you don't want.
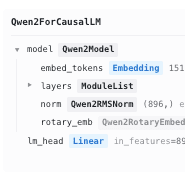
Reproduce the String Seed of Thought paper: showing LLMs struggle to sample uniformly and a trick to fix it.
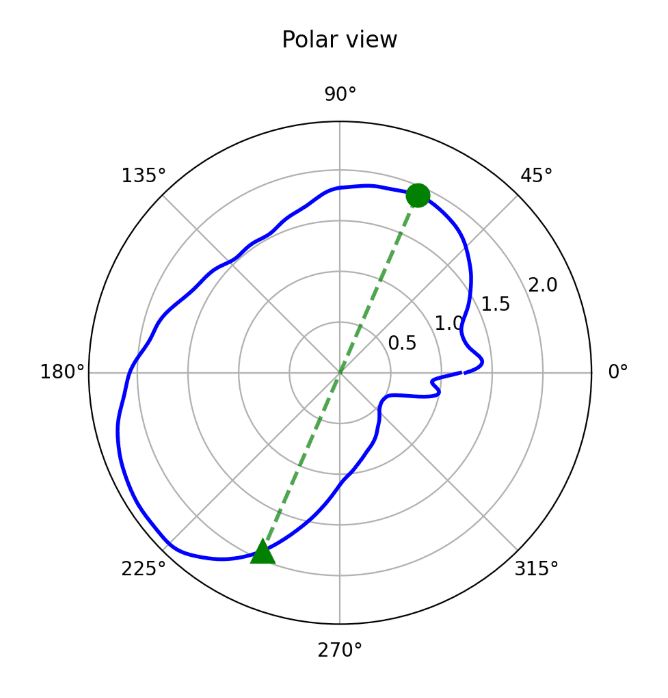
Can you draw a counter-example of the Borsuk-Ulam Theorem? Probably not.
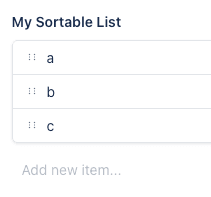
A draggable list for reordering items interactively.
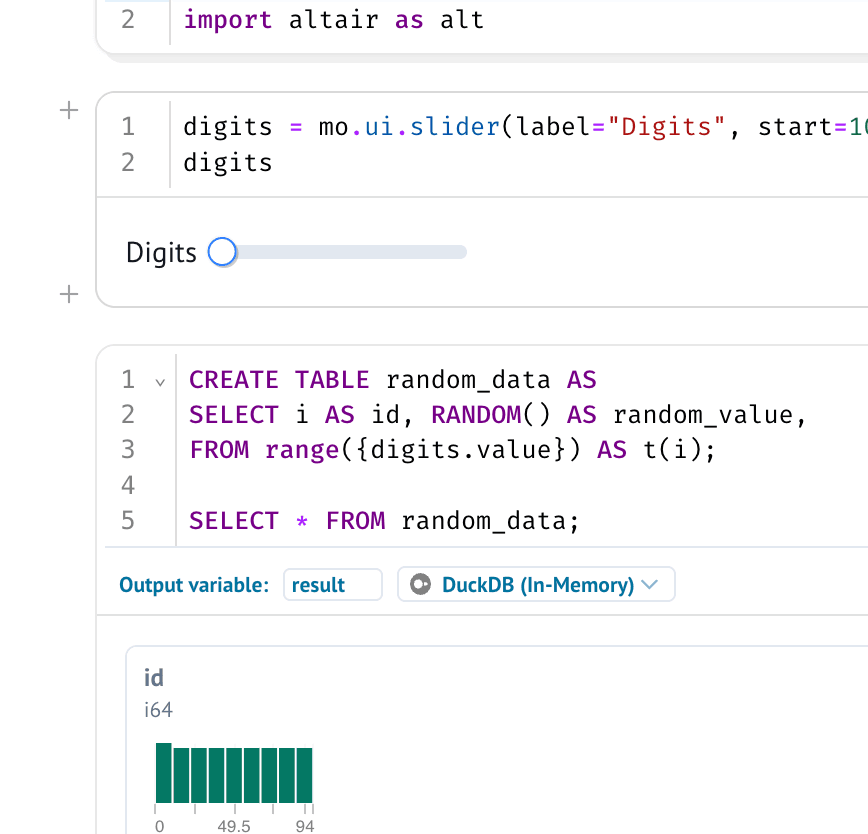
A demo of how to use marimo UI and f-strings to interpolate SQL queries.
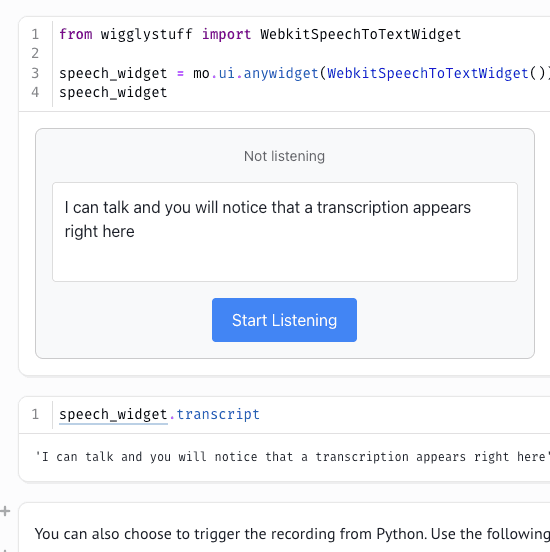
Convert voice input to text using the browser's speech recognition.
A utility widget for copying content to the clipboard.
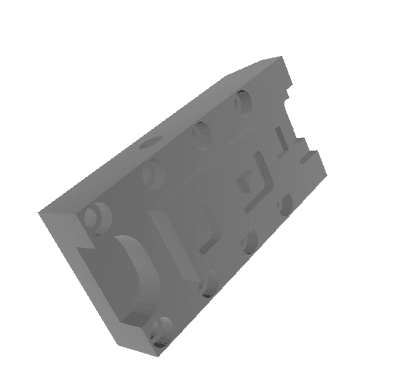
Grab 2D slices using trimesh, a Python library to work with 3D files.
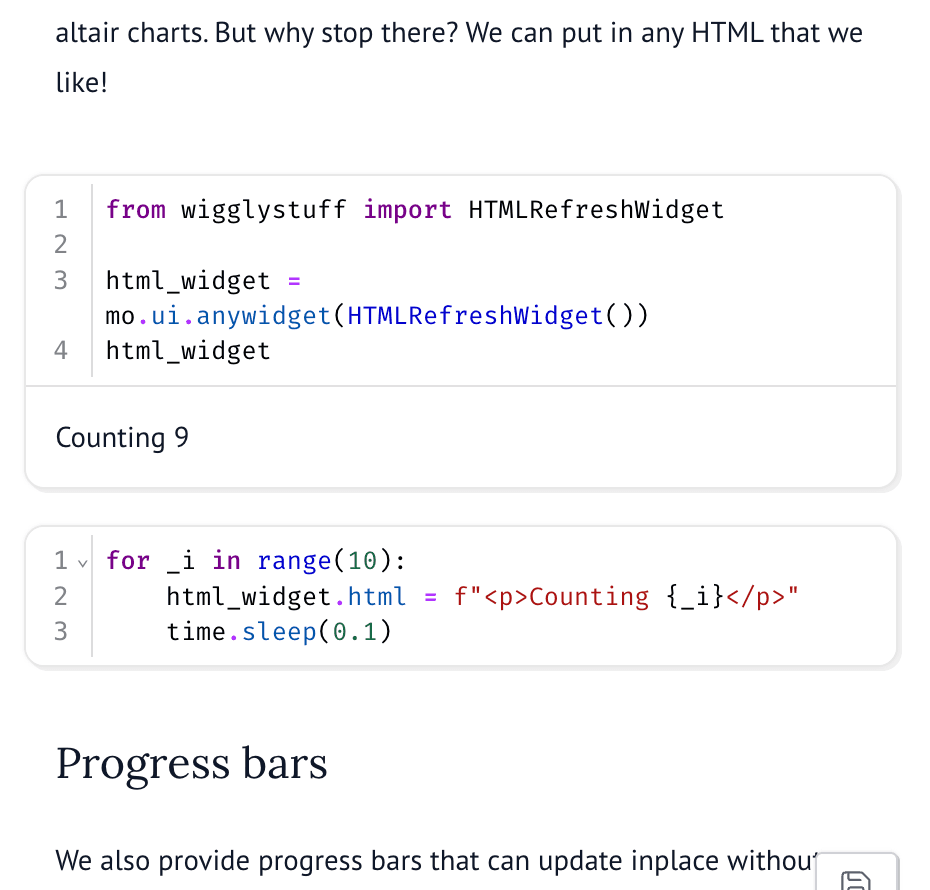
Render dynamic HTML content that auto-refreshes.
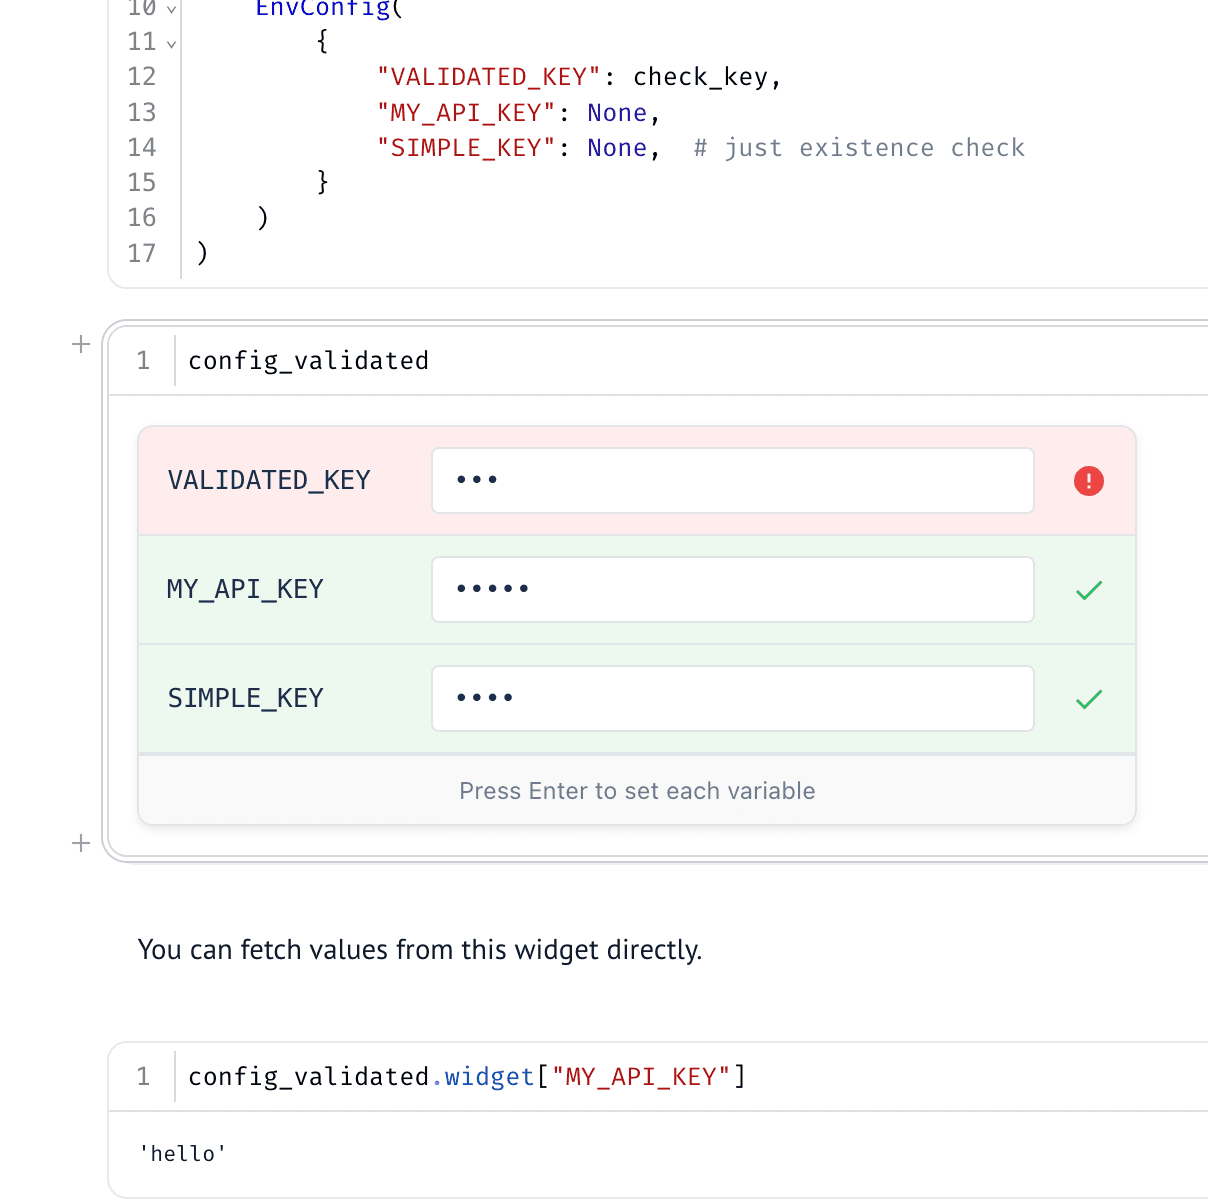
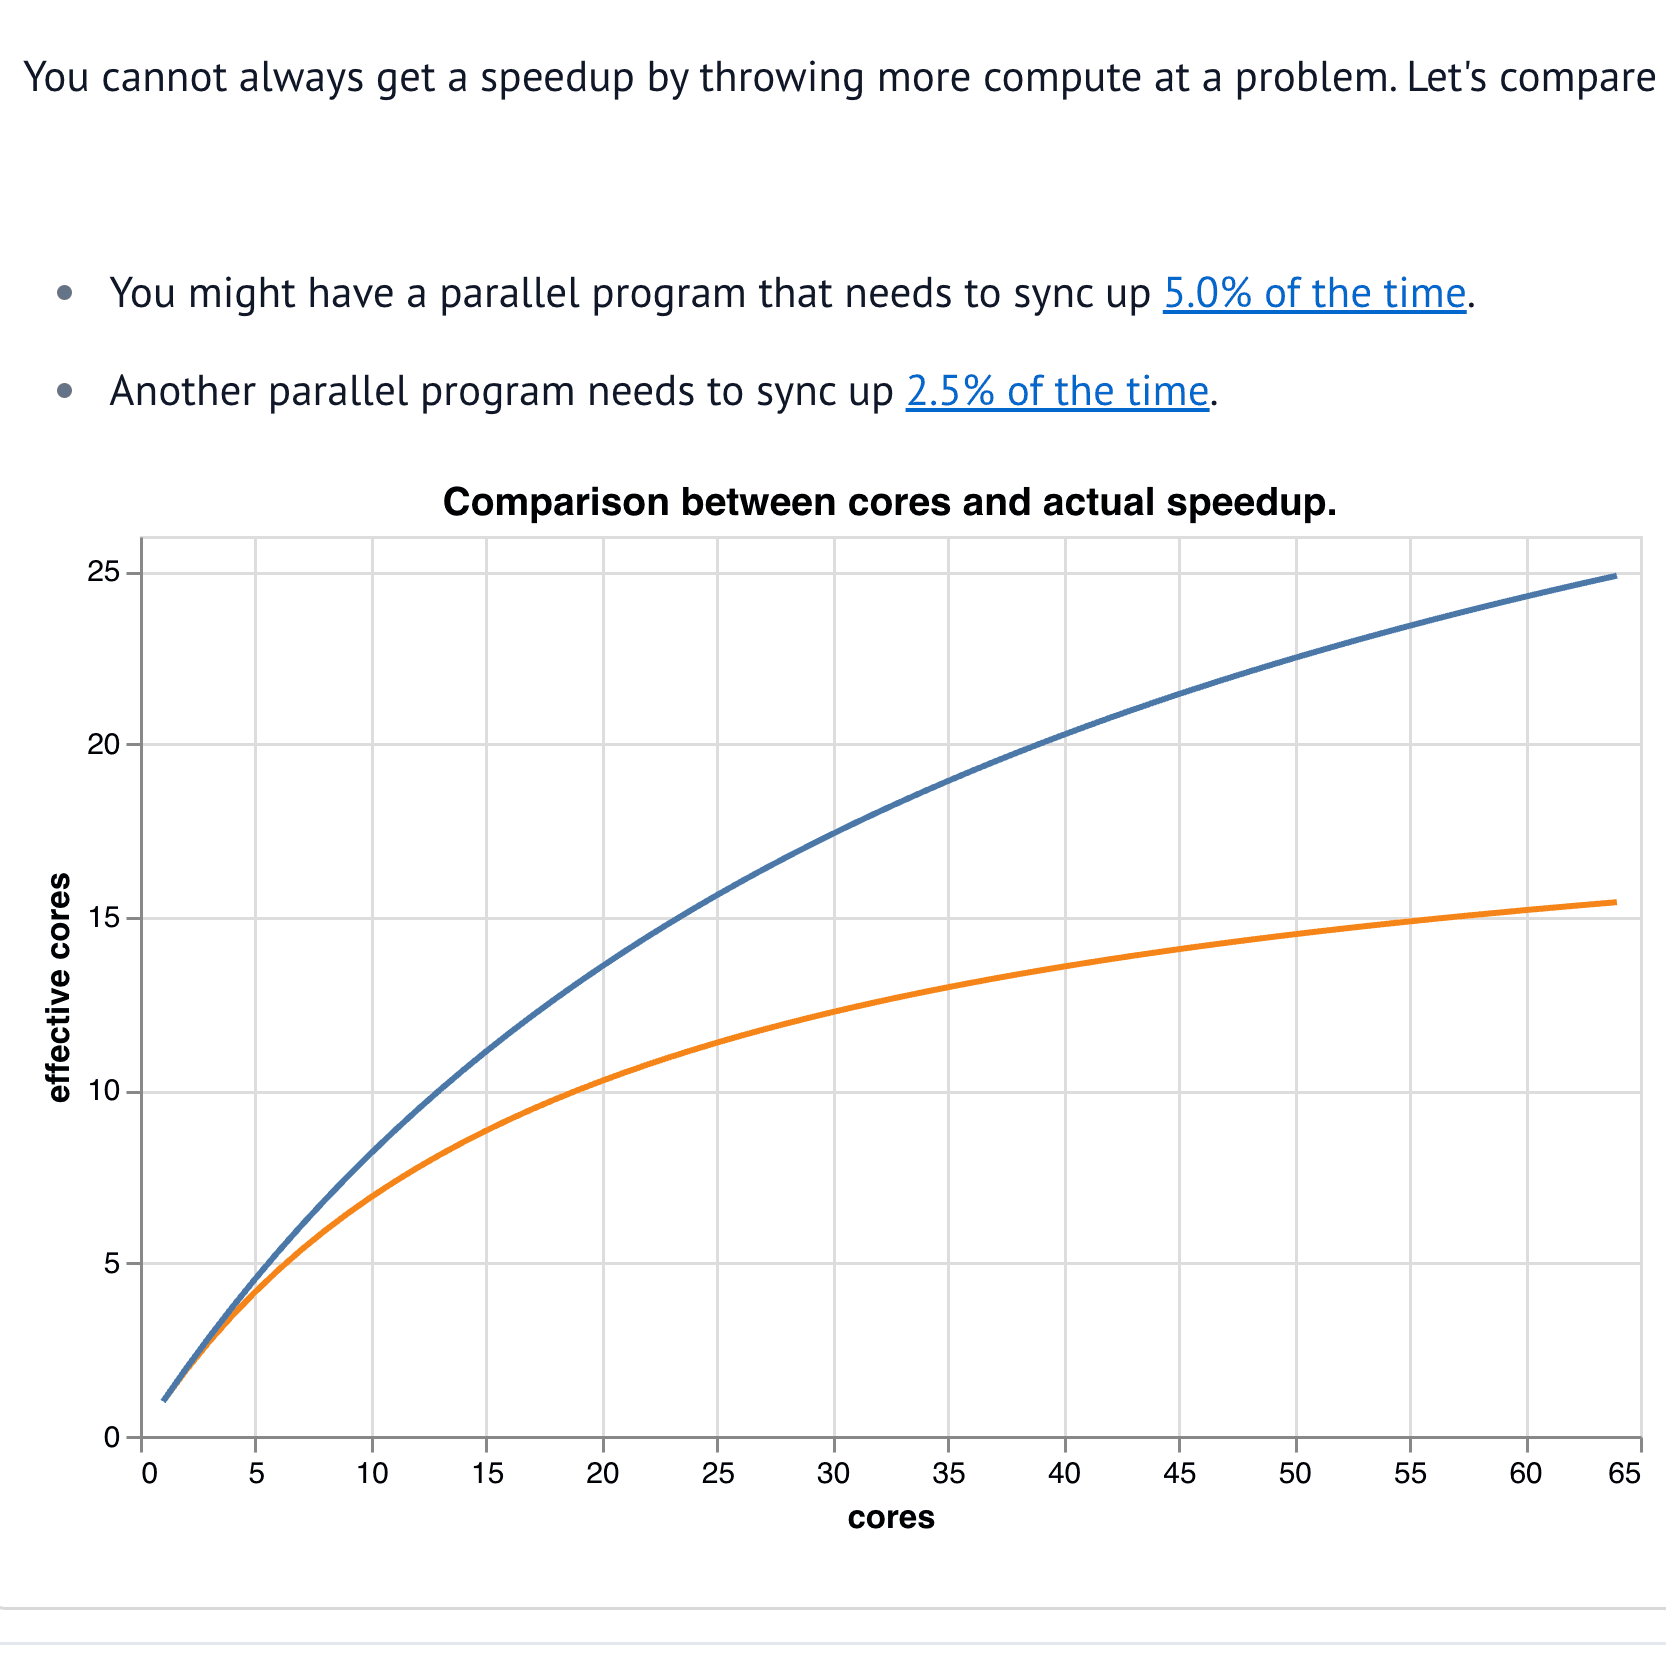
Interactive number manipulation with draggable values in text.
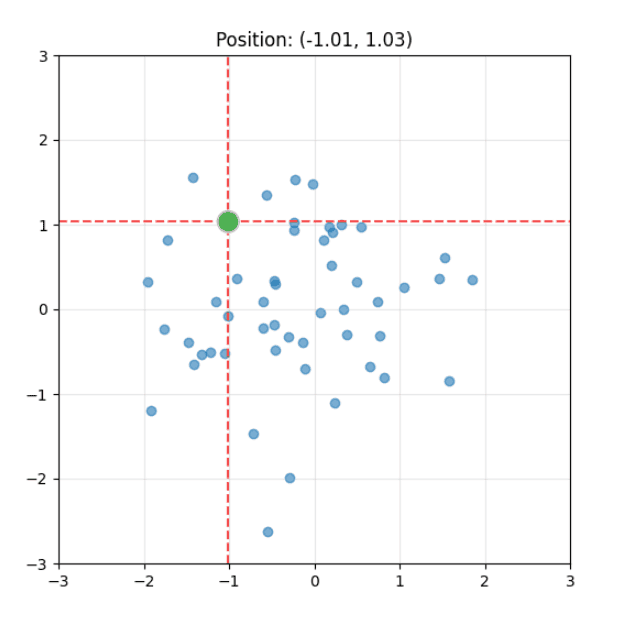
Interactive chart editor with draggable control points.
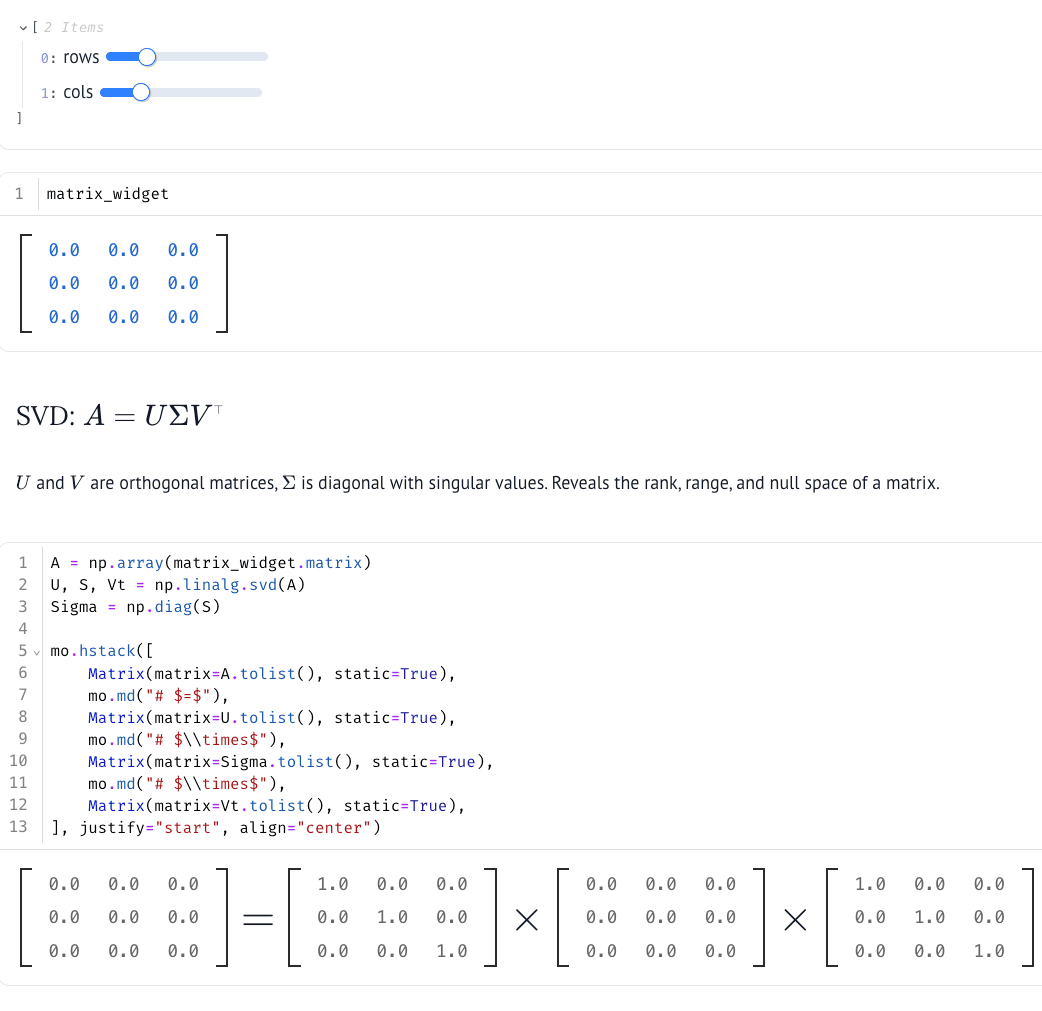
An interactive exploration of matrix decomposition techniques.
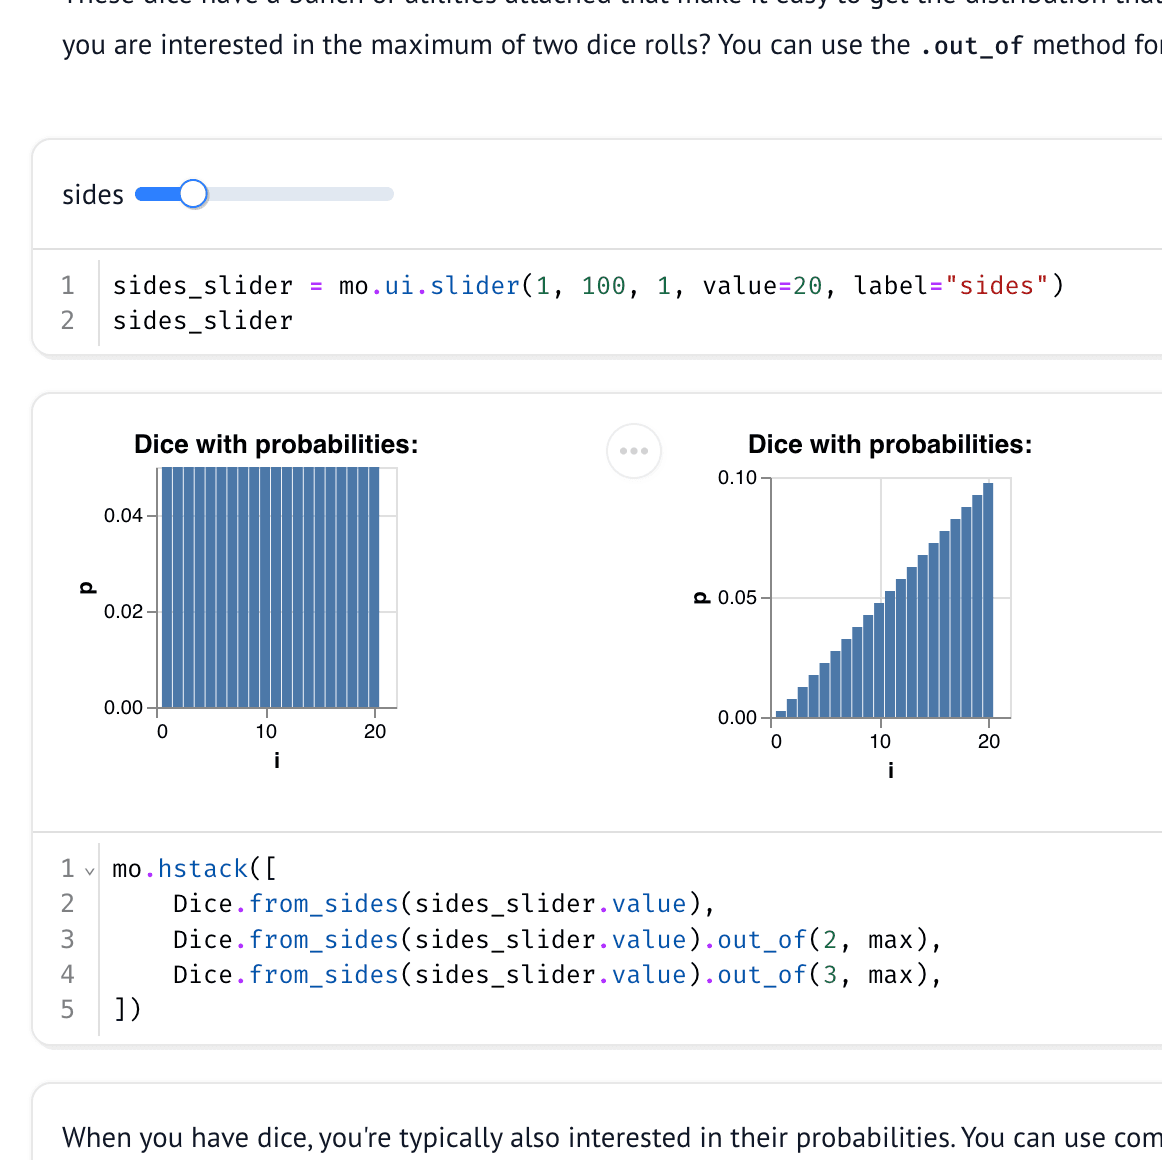
An interactive exploration of dice probability calculations and distributions.
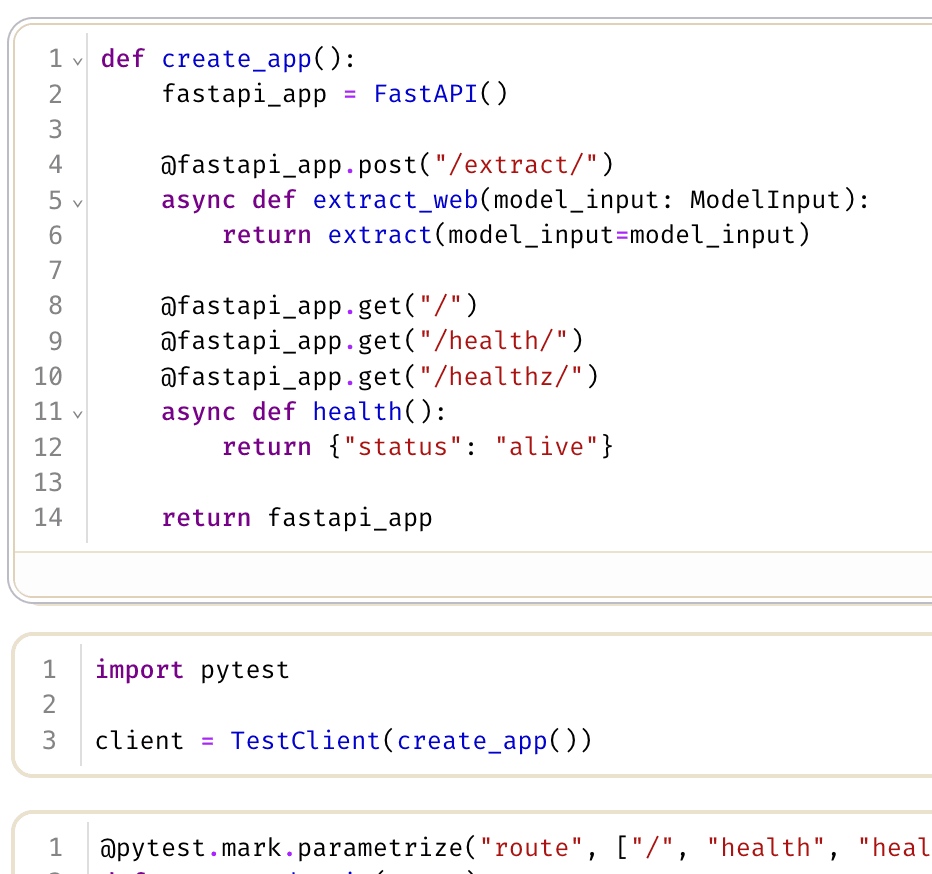
Demo showing GliNER v2 for zero-shot entity extraction, runnable as webapp, API, or CLI.
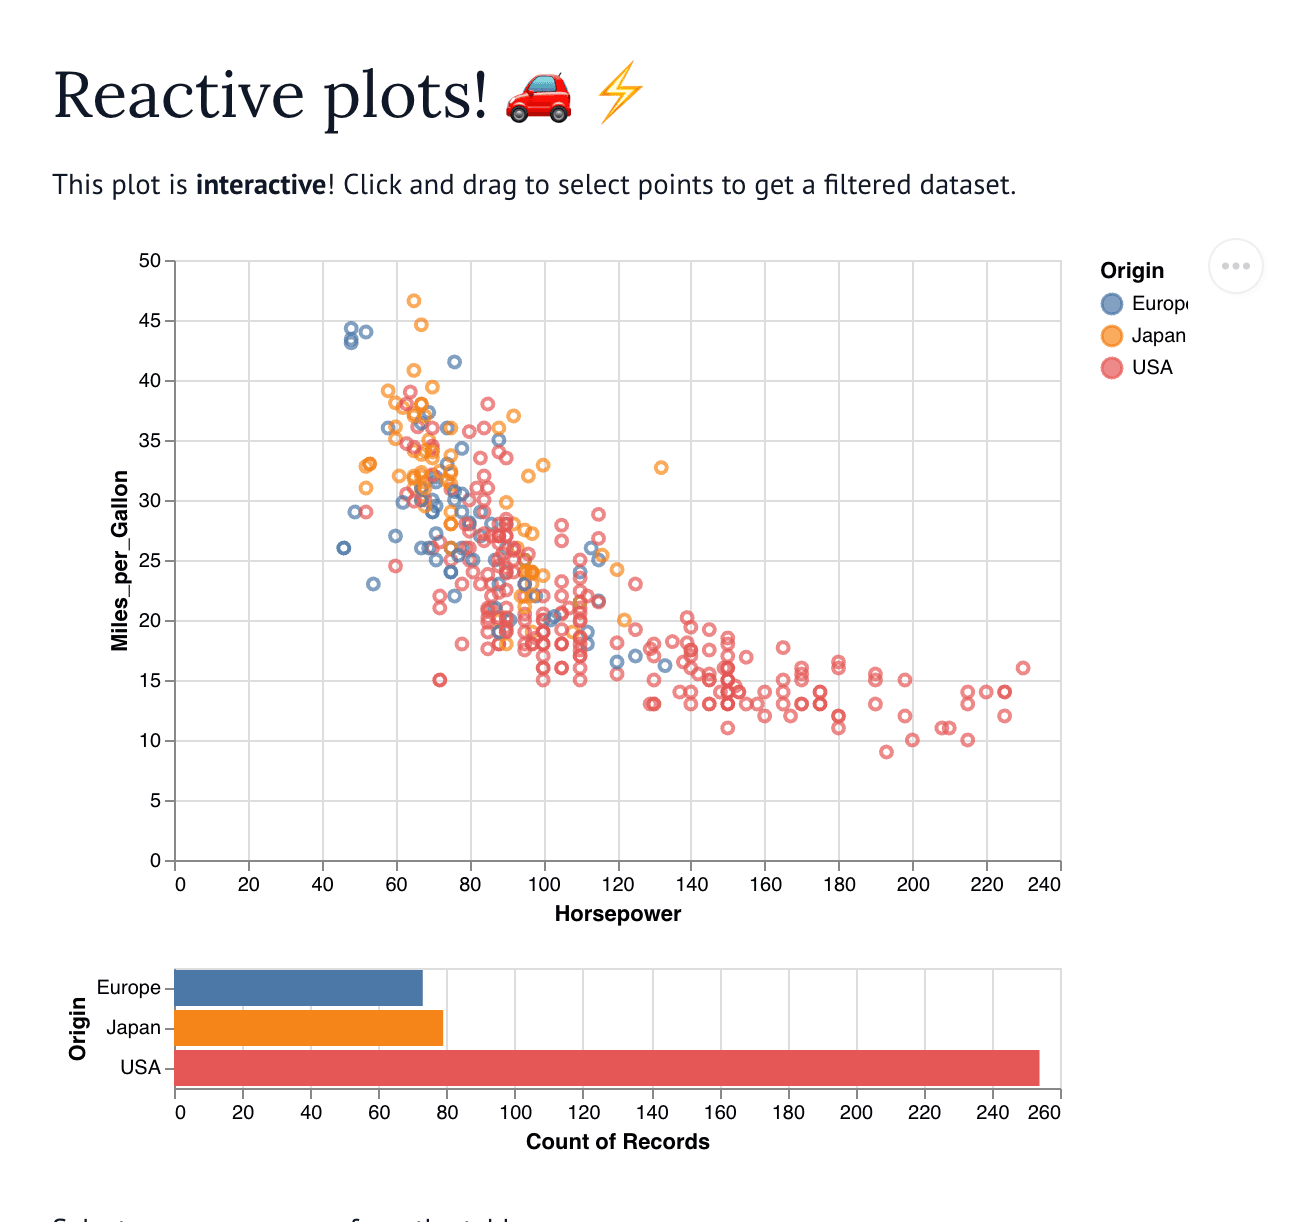
Interactive Altair charts with brush selection and reactive filtering.
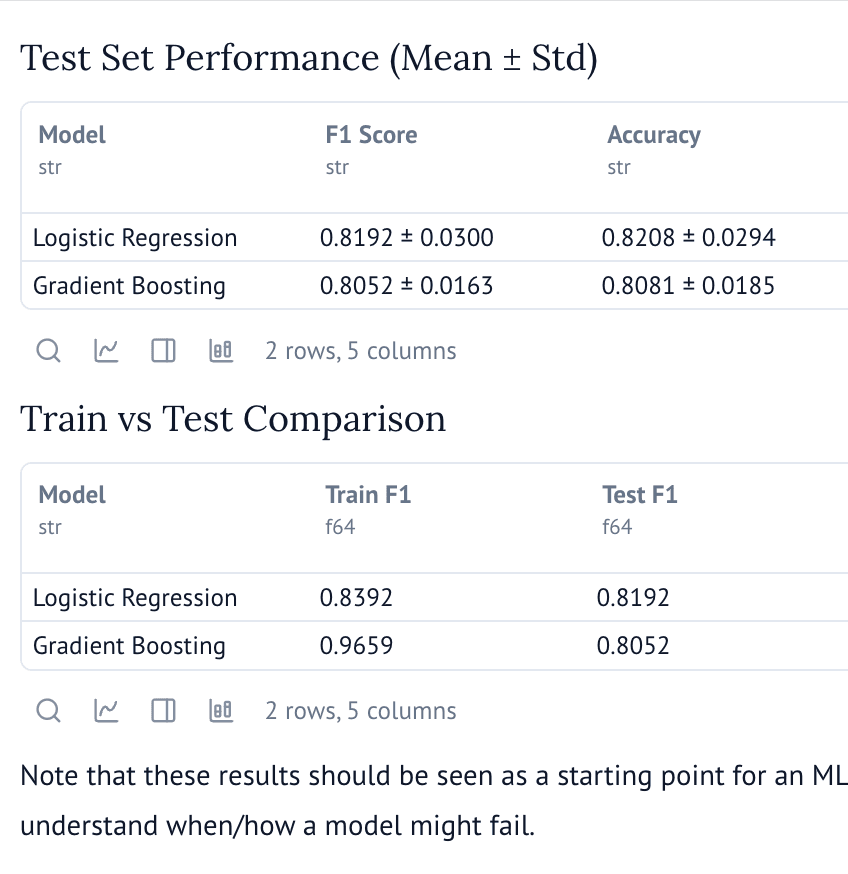
Bootstrap scikit-learn classification models with automatic preprocessing and cross-validation.
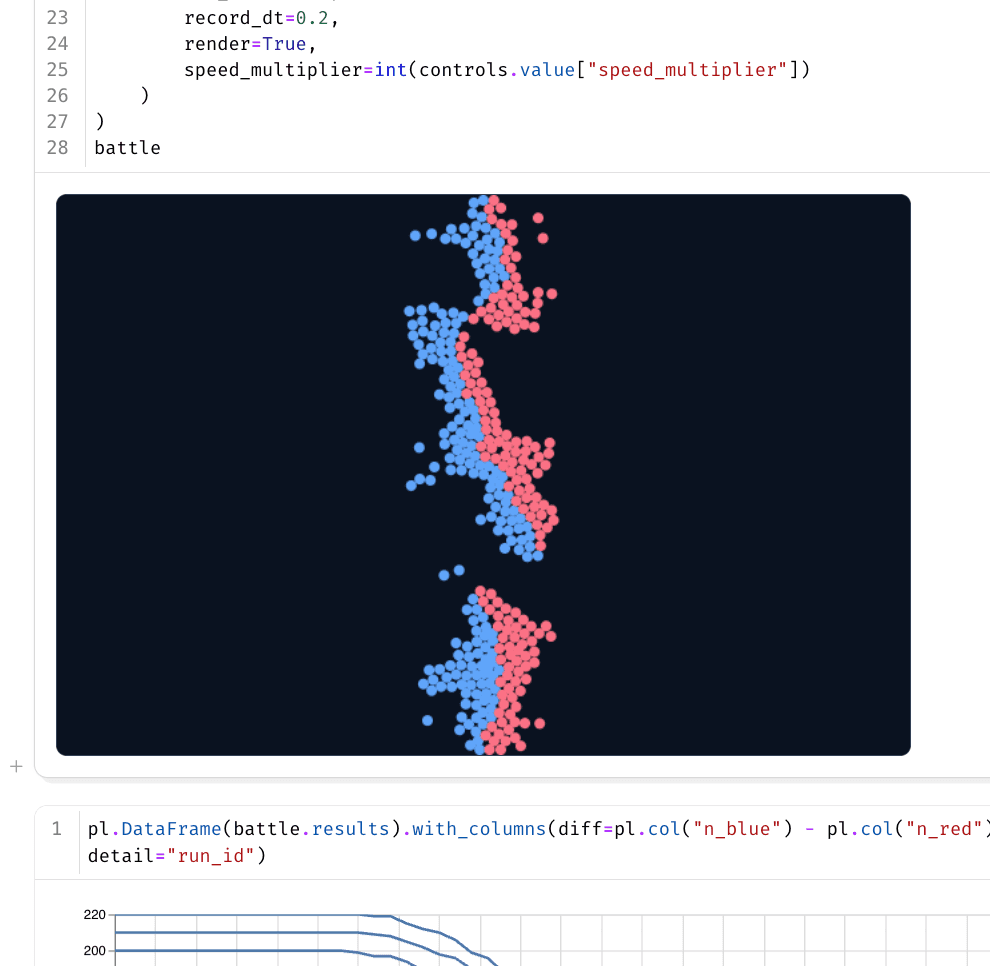
Interactive simulation of Lanchester's Laws of combat
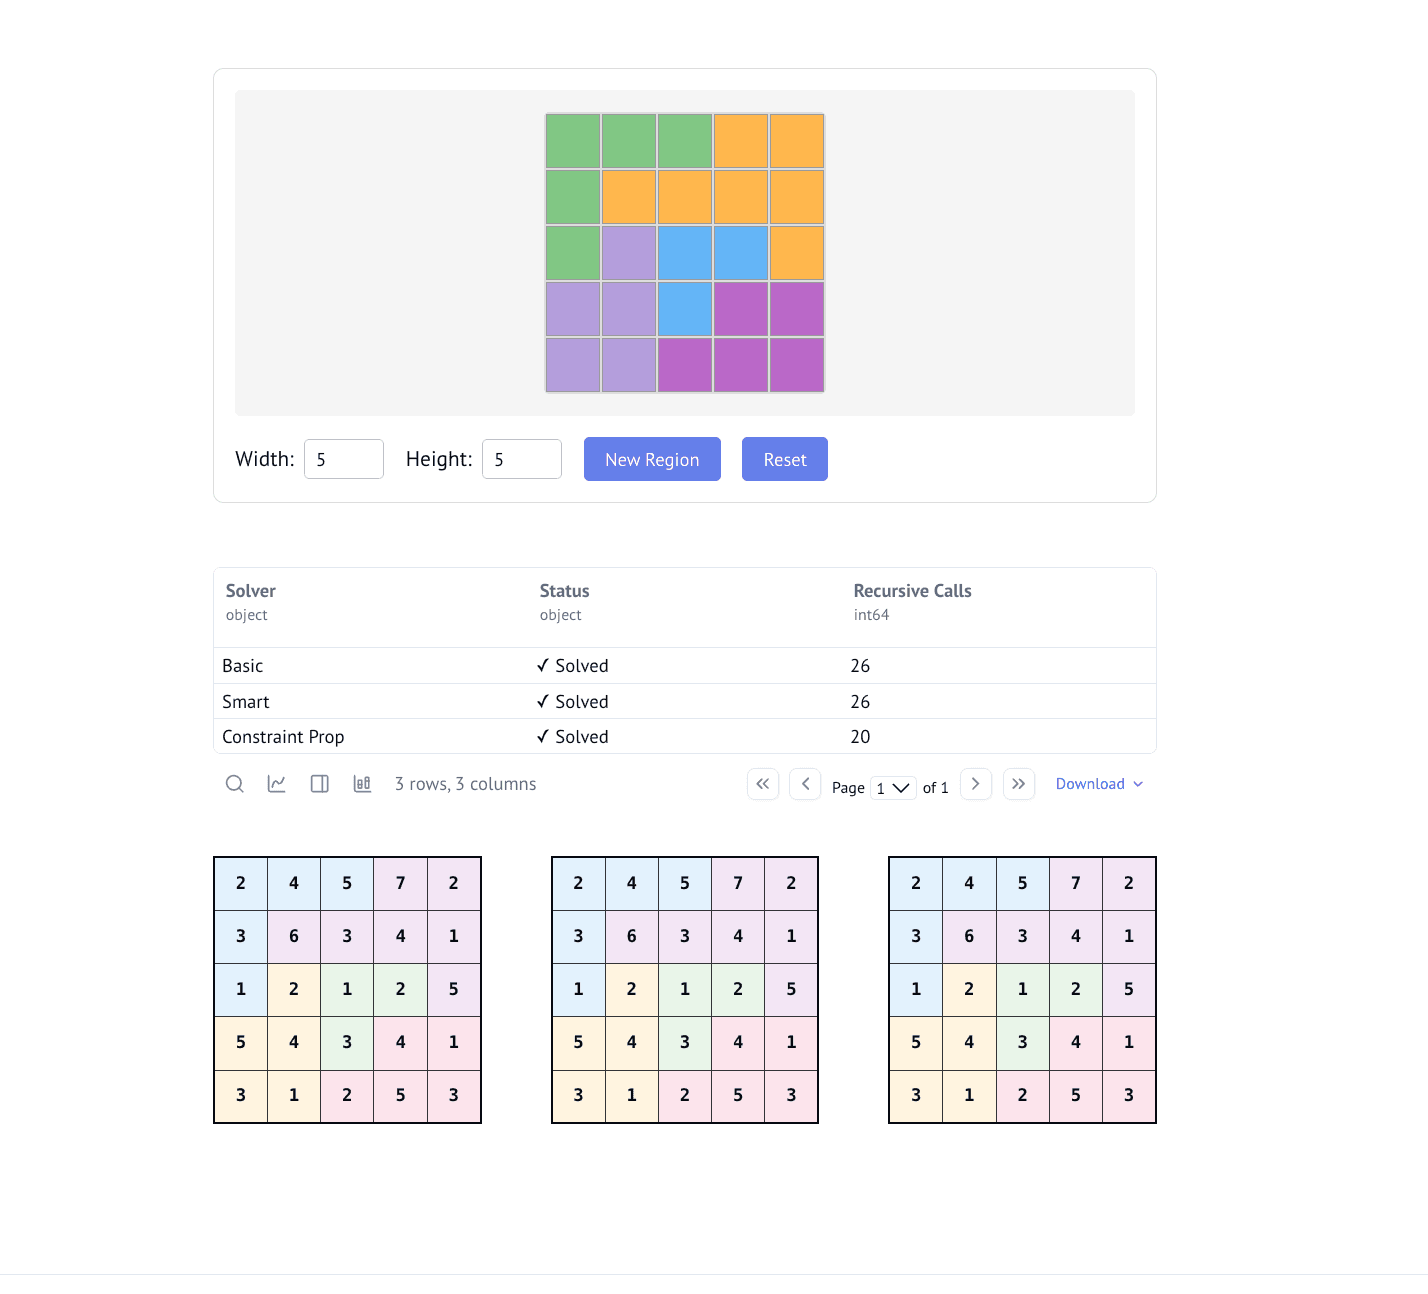
Interactive Suguru puzzle solver and generator
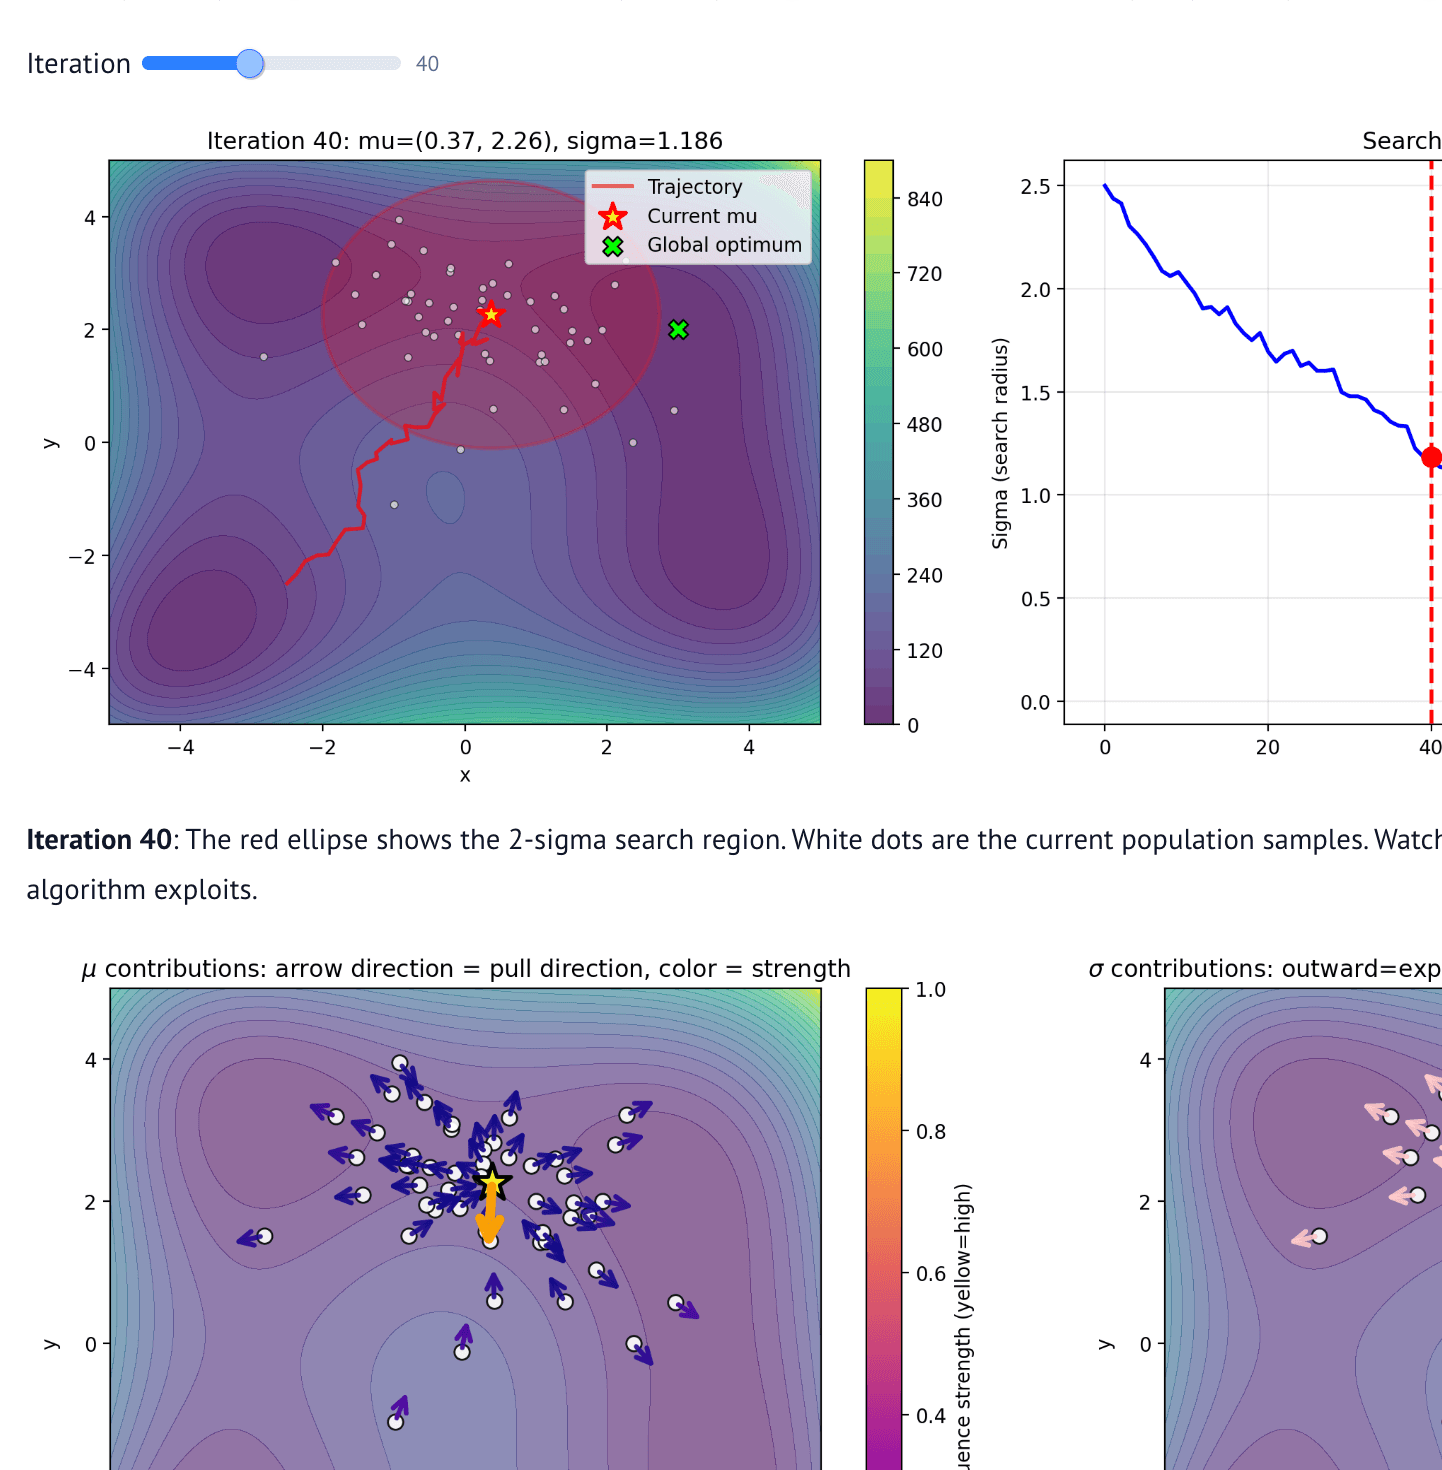
Interactive exploration of evolutionary optimization algorithms
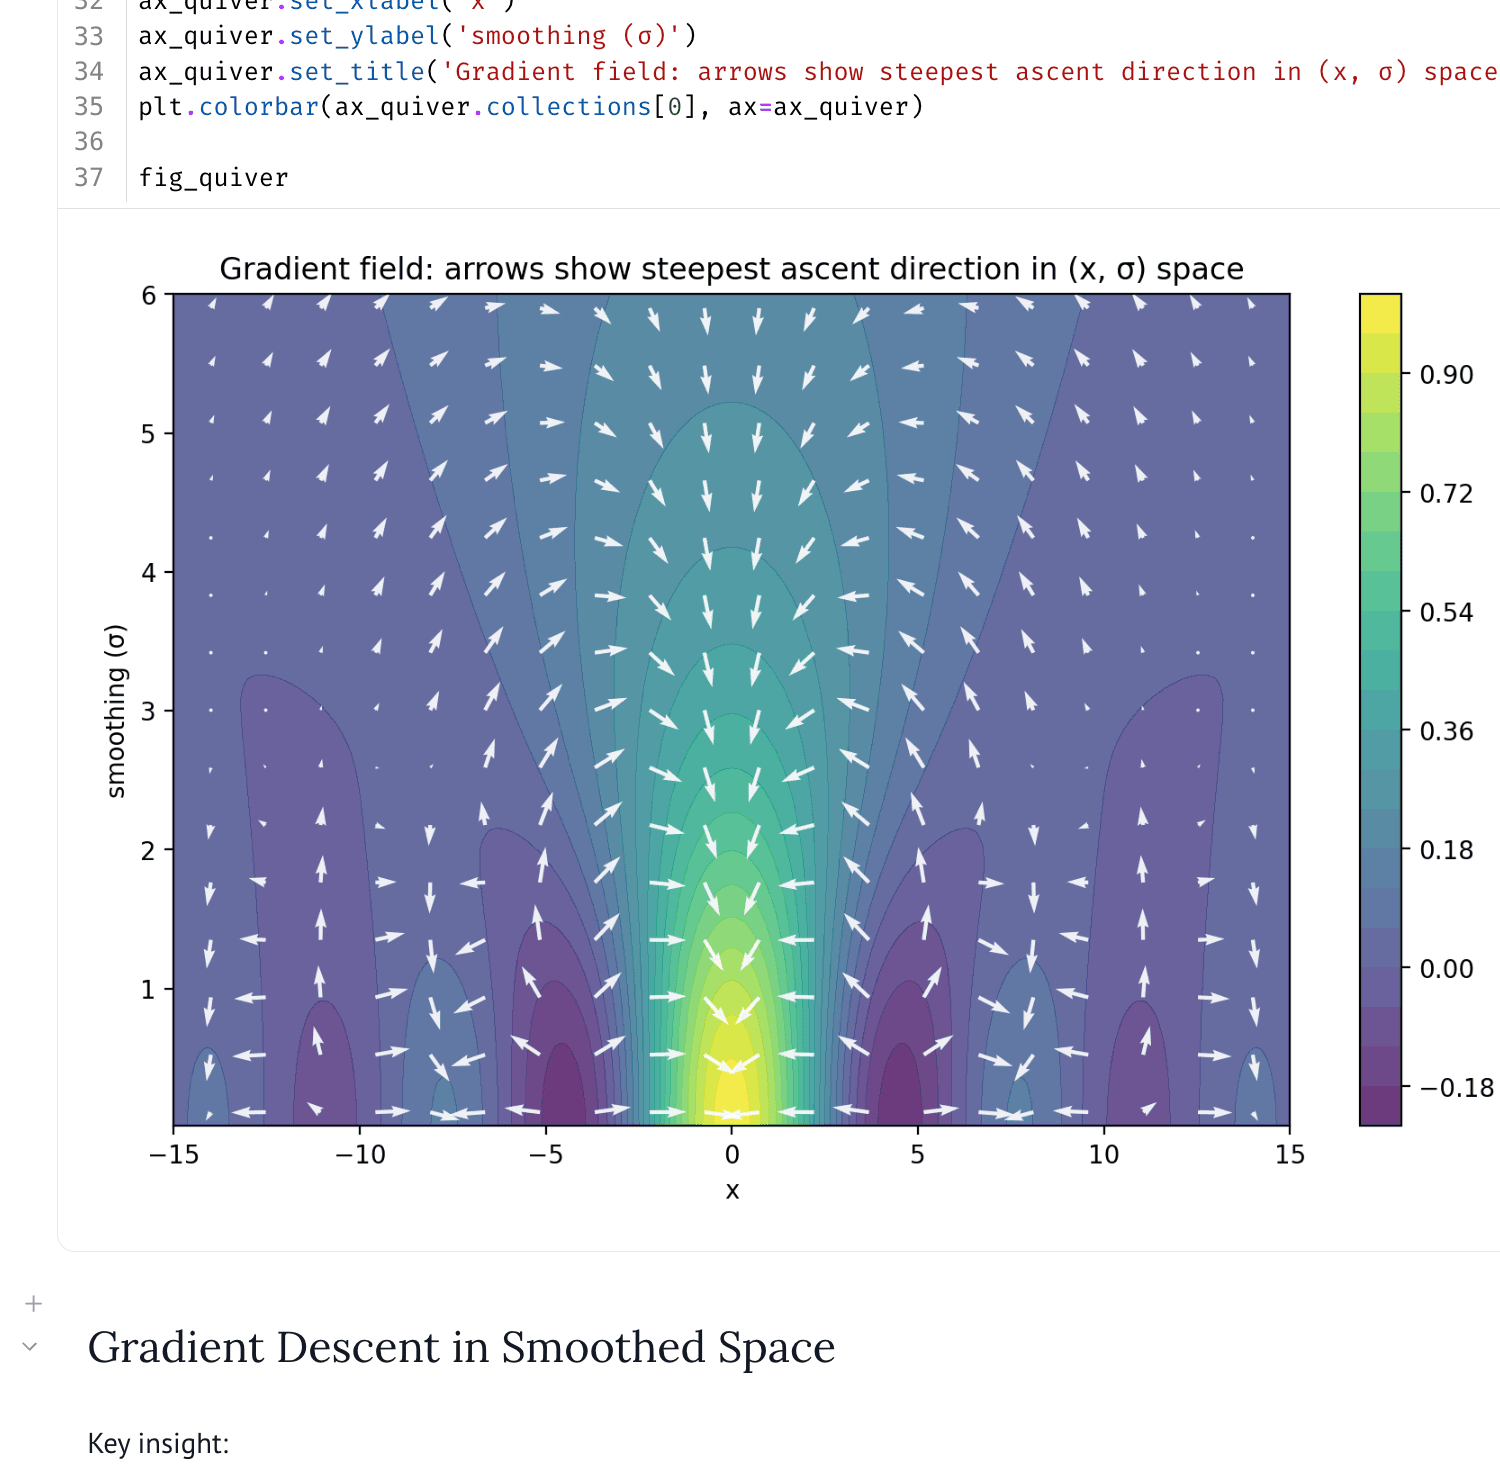
Visualize gradient descent with momentum and smoothing techniques
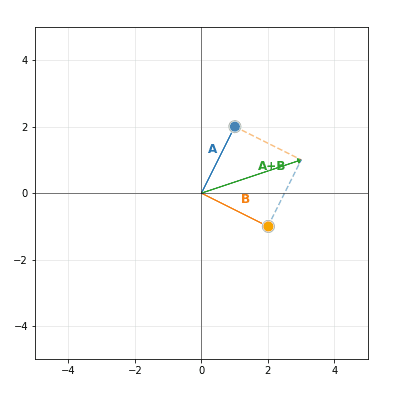
Explore vector arithmetic with pucks over matplotlib
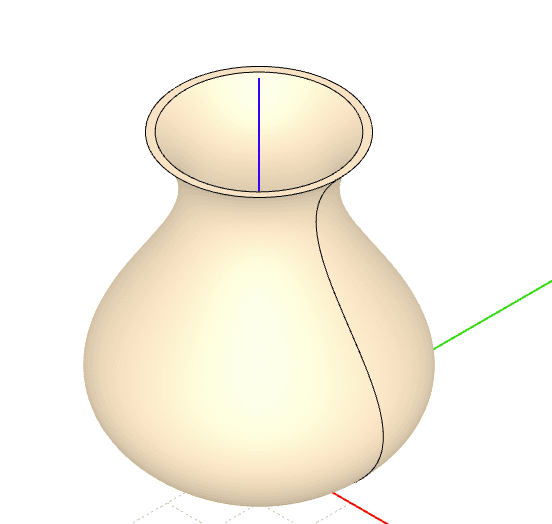
Make a vase for 3d printing with marimo-cad
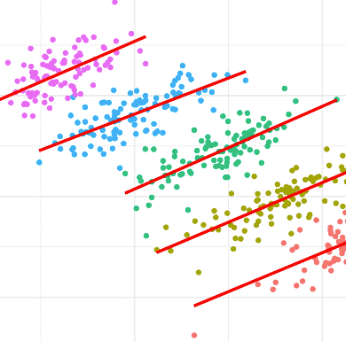
Explore Simpson's paradox with Bayesian modeling, showing how confounding variables can reverse observed trends.
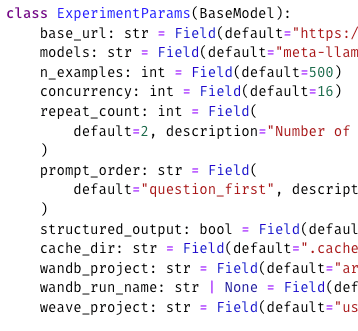
Reproduce research on prompt repetition with a notebook that can run experiments properly.
Visualize molecular chemical space using t-SNE and HDBSCAN clustering.
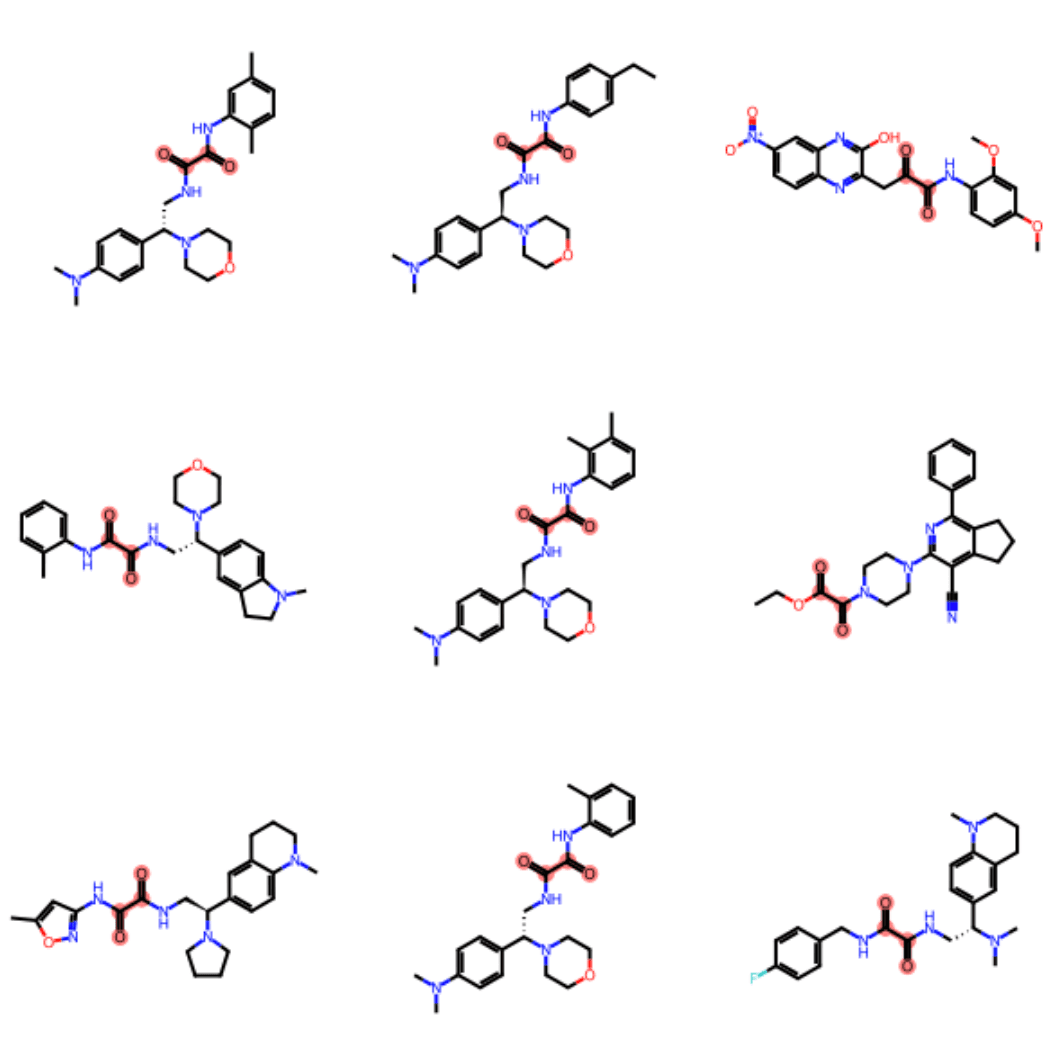
Explore Butina clusters of aligned chemical structures with an interactive cluster viewer.
A 2D slider control for selecting x/y coordinates interactively.
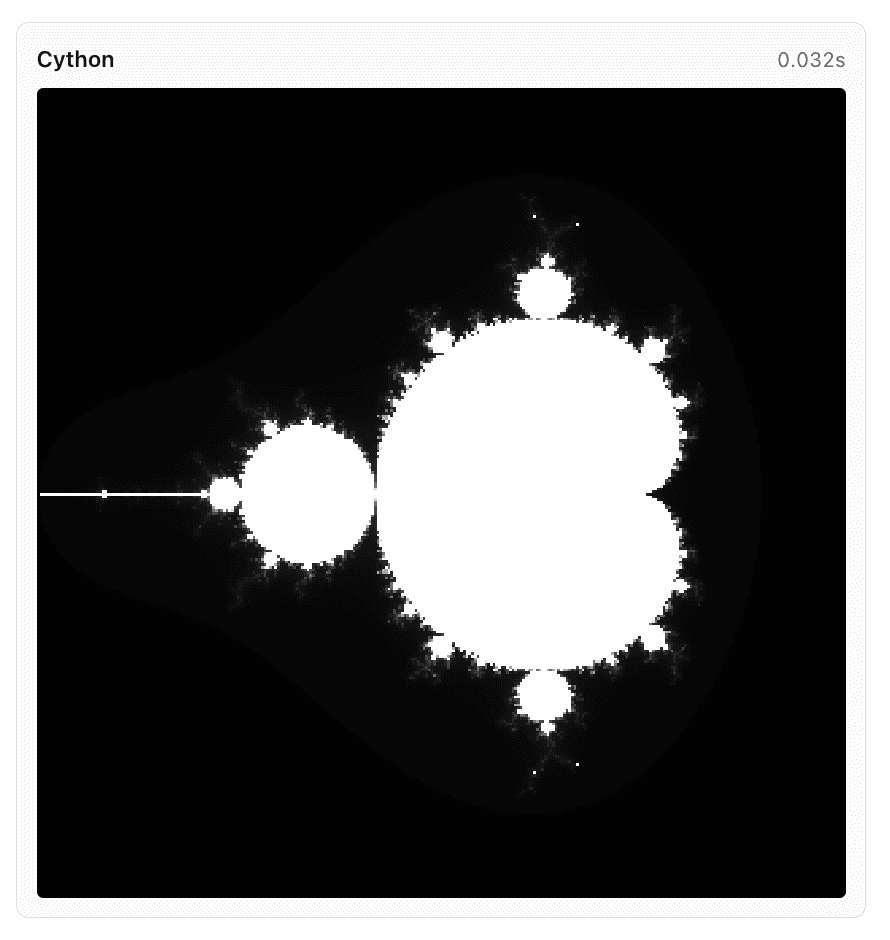
Mandelbrot set computation that uses the marimo-cython plugin for speedup.
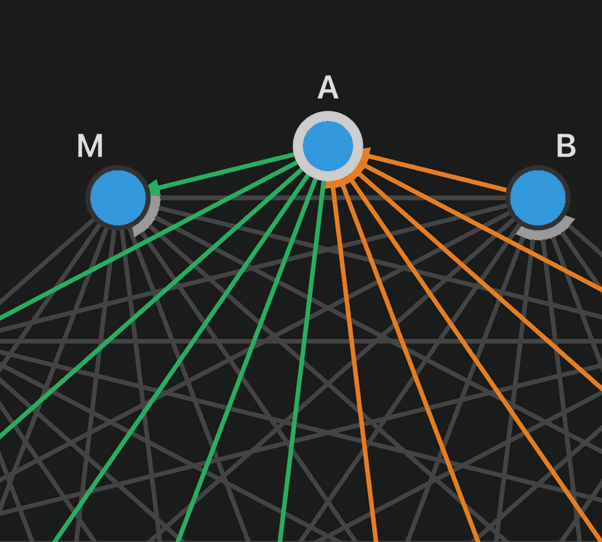
Explore why fair games require an odd number of elements through interactive game theory math.
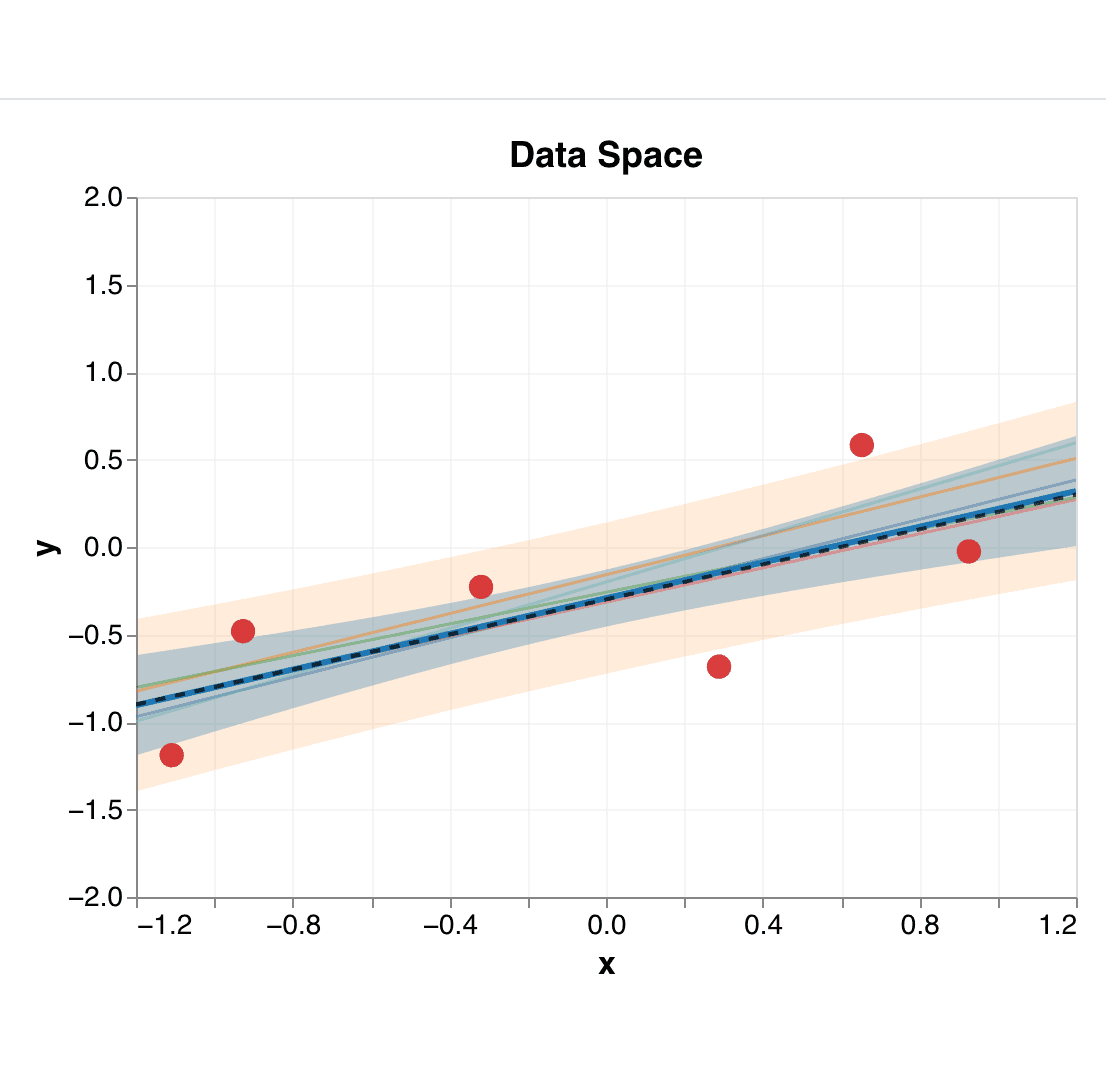
Interactive Bayesian linear regression showing how posterior distributions evolve as data points are added.
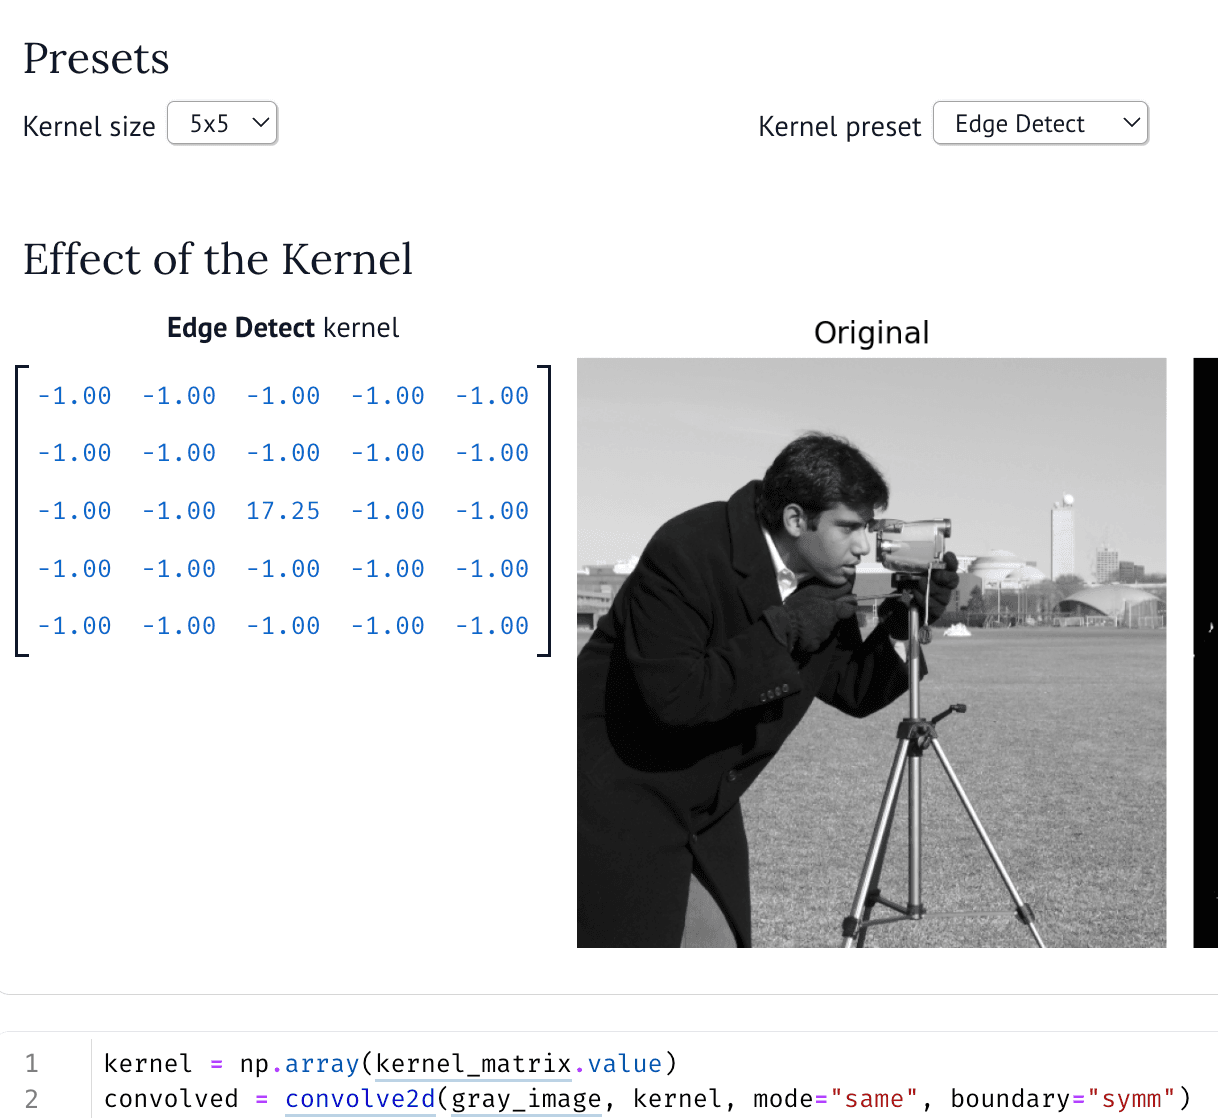
Interactive exploration of 2D image convolution kernels with real-time side-by-side previews.
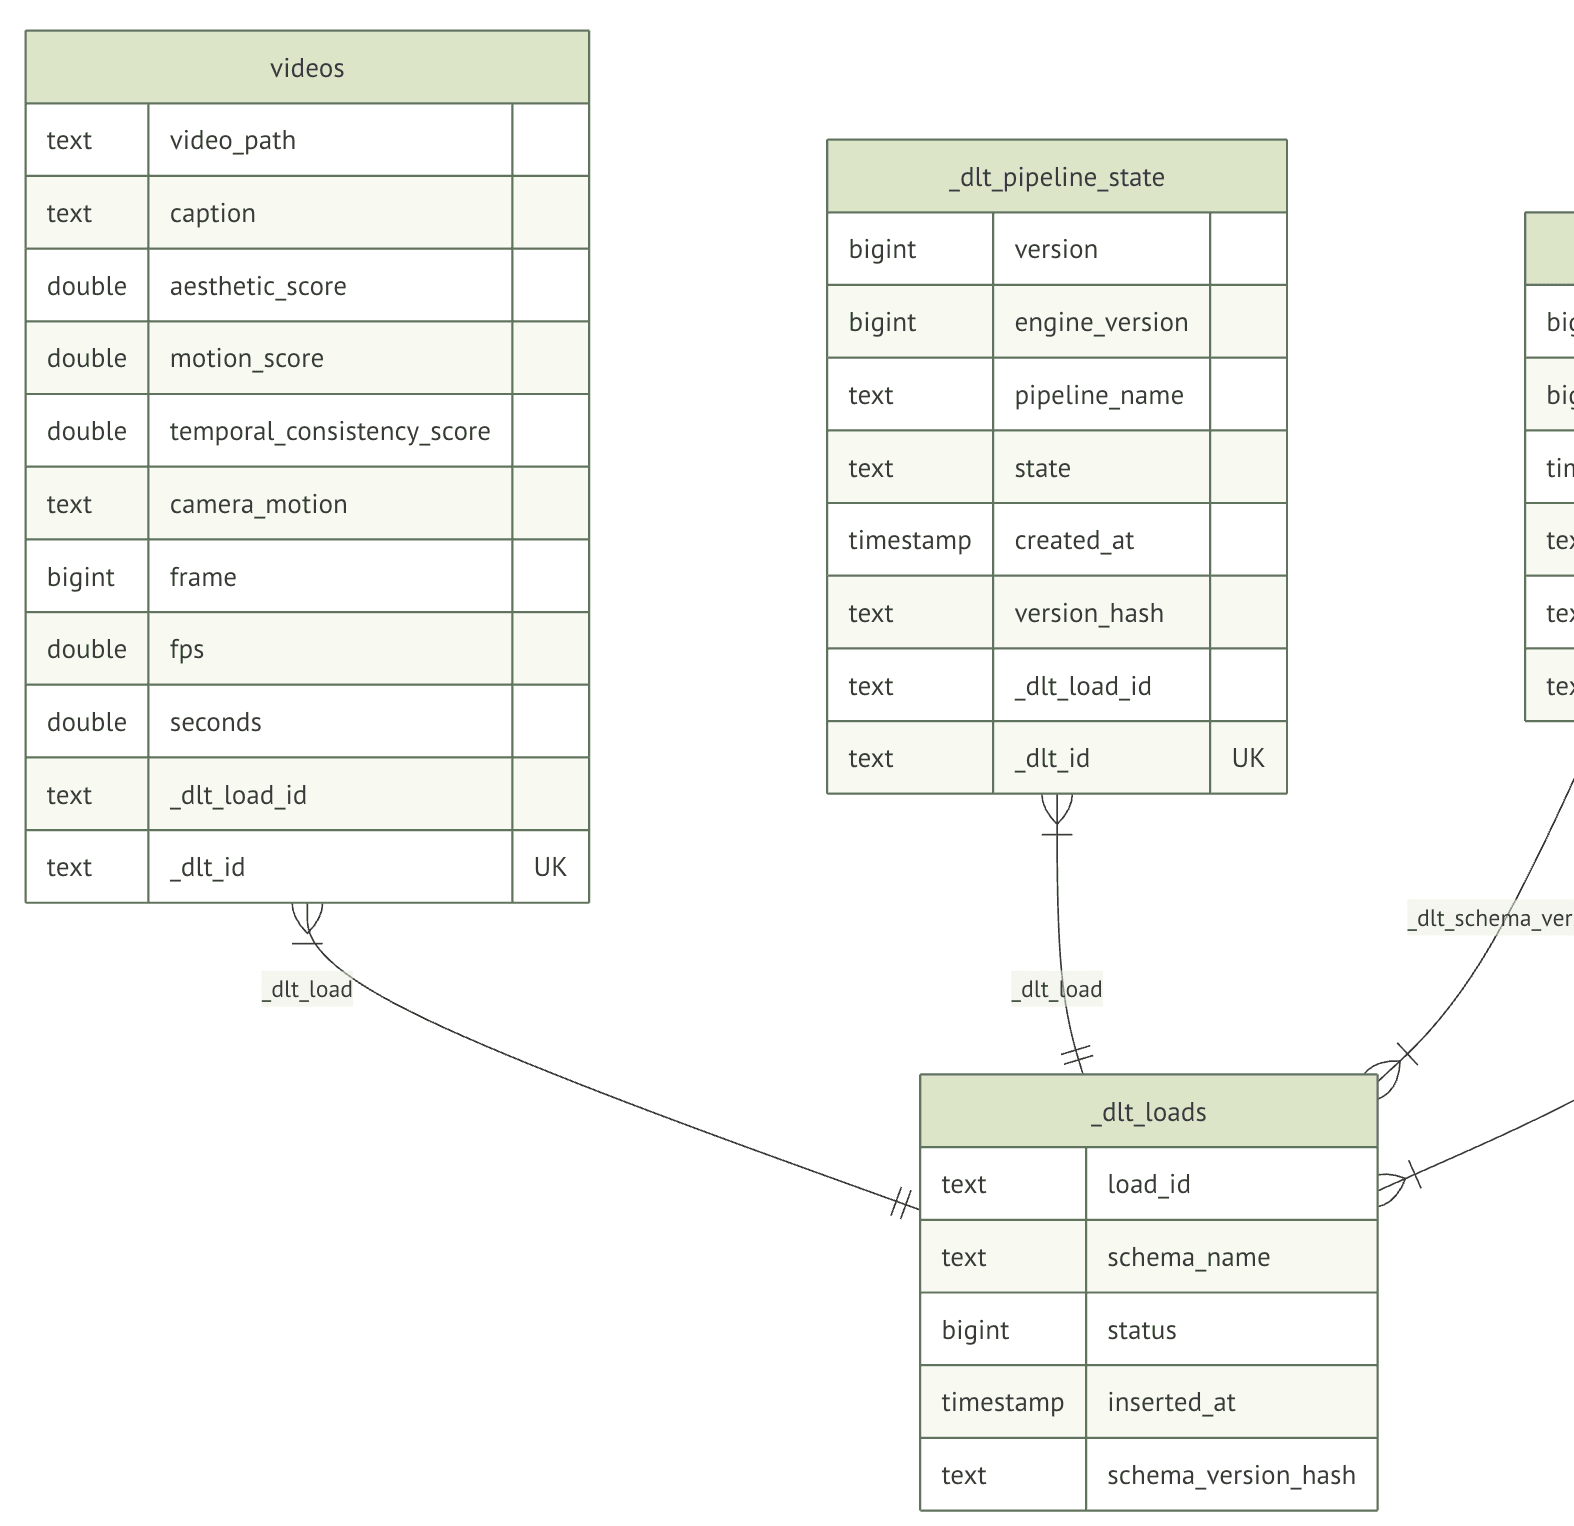
Load, validate, filter, and publish ML datasets using dlt pipelines with Hugging Face and LanceDB.
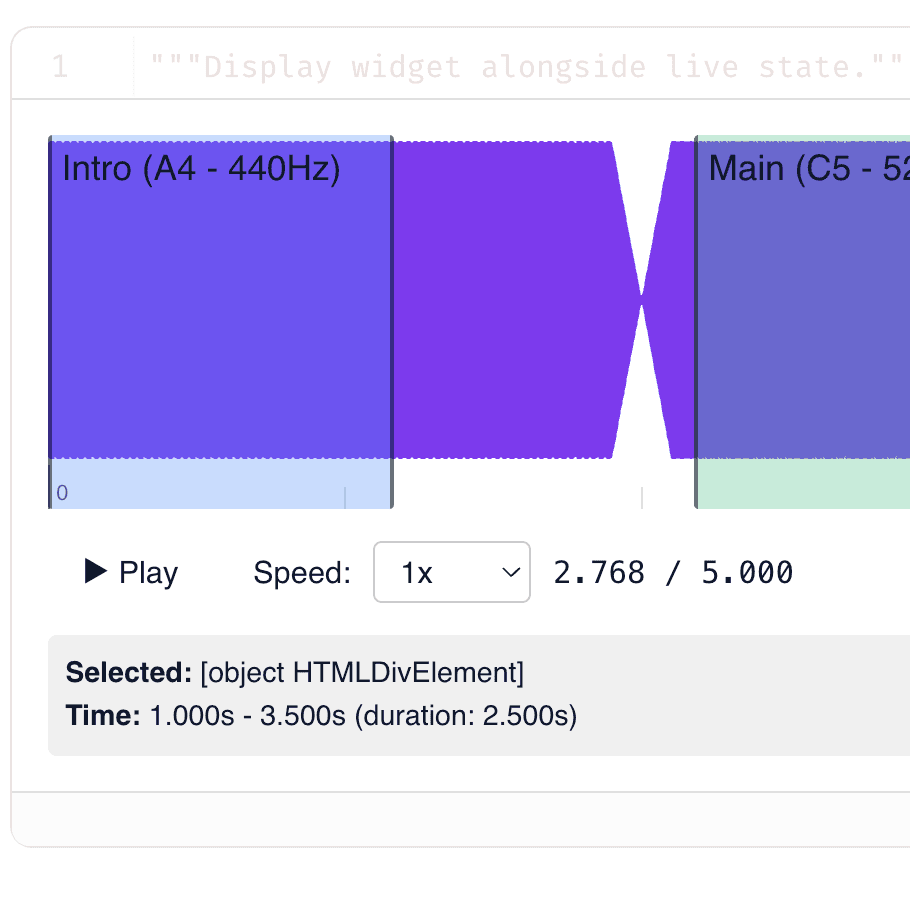
Custom audio widget for annotation using anywidget and wavesurfer.js.
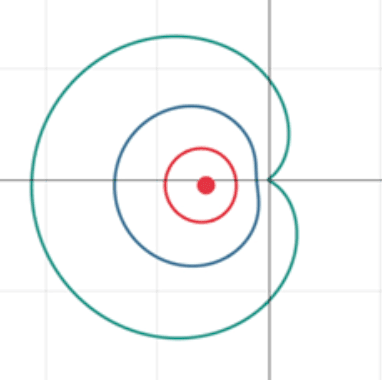
How complex functions like z², 1/z, and e^z transform images using an interactive puck.
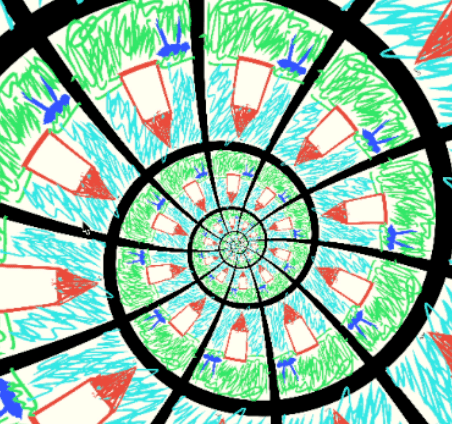
Interactive recursive zoom simulator with log-polar coordinate transformations and paint!
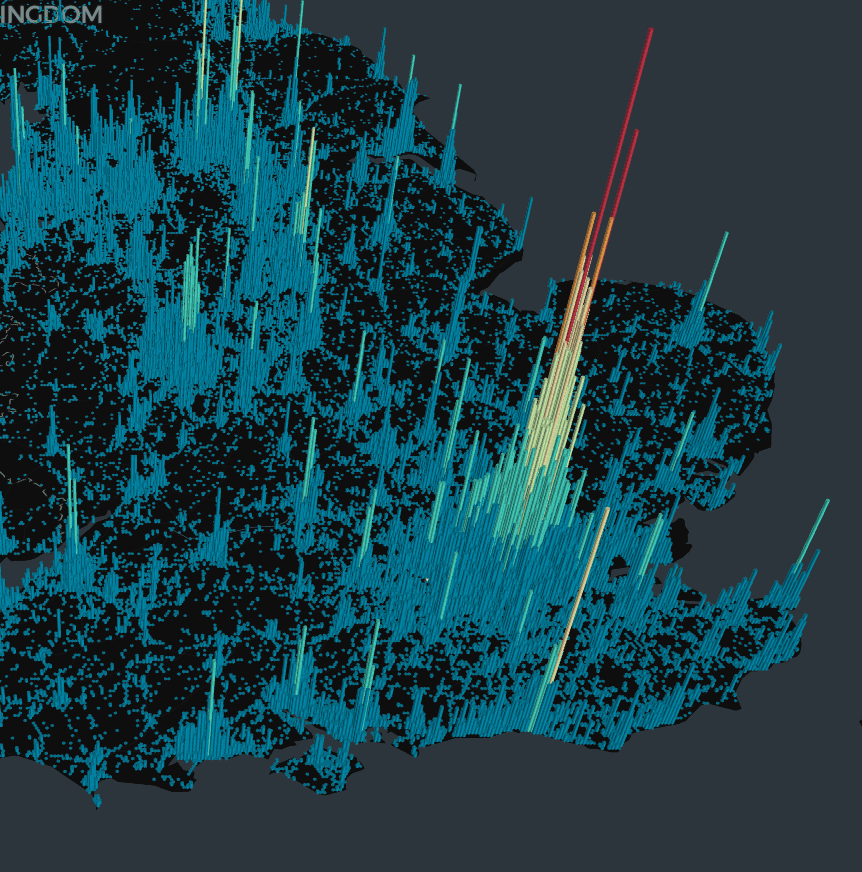
Interactive 3D hexagonal heatmap on a map with adjustable radius, coverage, and elevation.
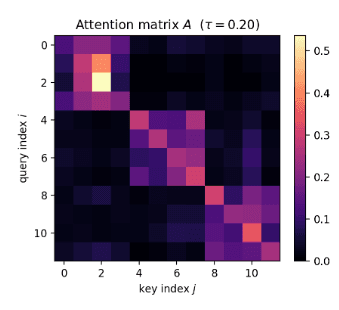
A primer on self-attention, a building block for modern Transformers.
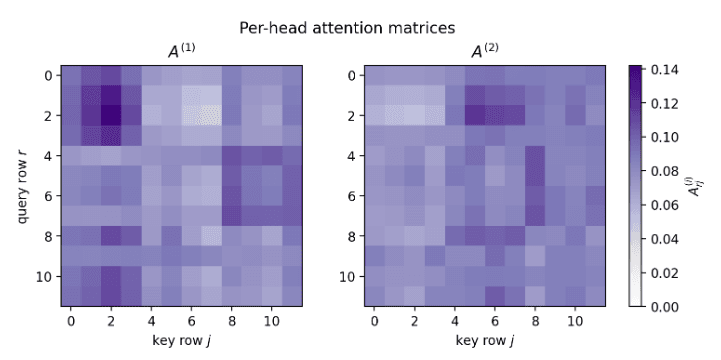
A primer on multi-head attention, the standard attention block used in modern Transformers.
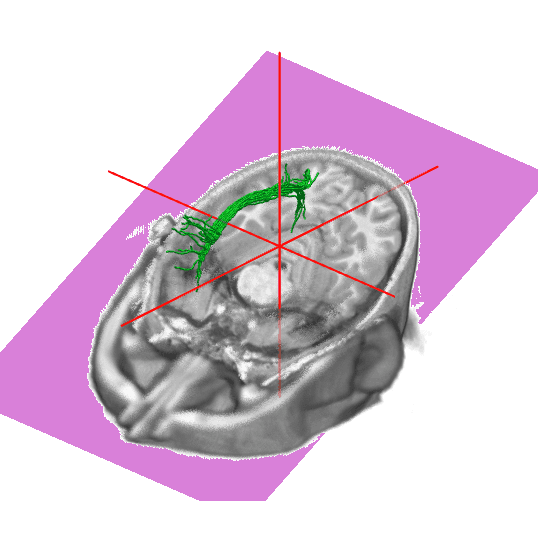
Visualization of diffusion MRI tractography, with a widget to explore slices of a human brain by scrolling.
Predict carbohydrate-active enzyme families from protein embeddings using a random forest model with a neural network.
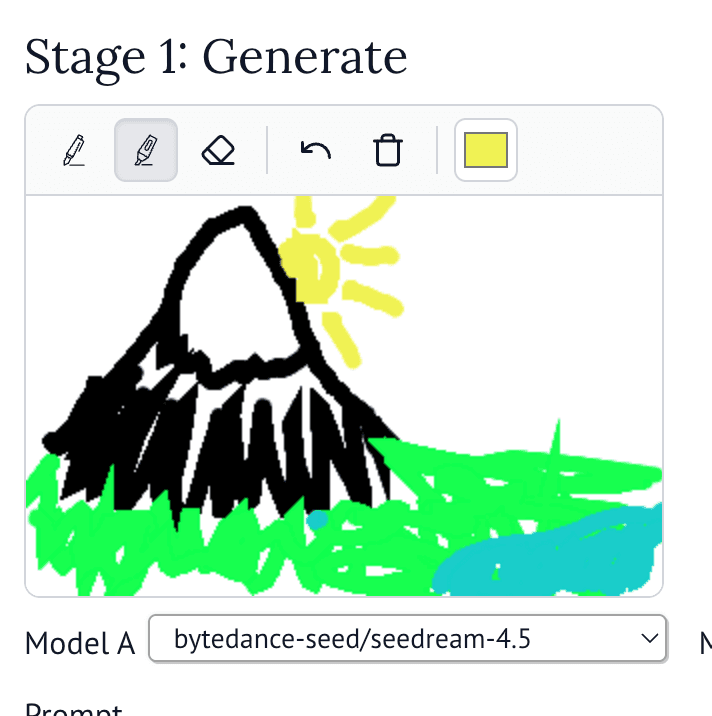
Compare image-generation models side-by-side through OpenRouter, with optional sketch-based prompting.
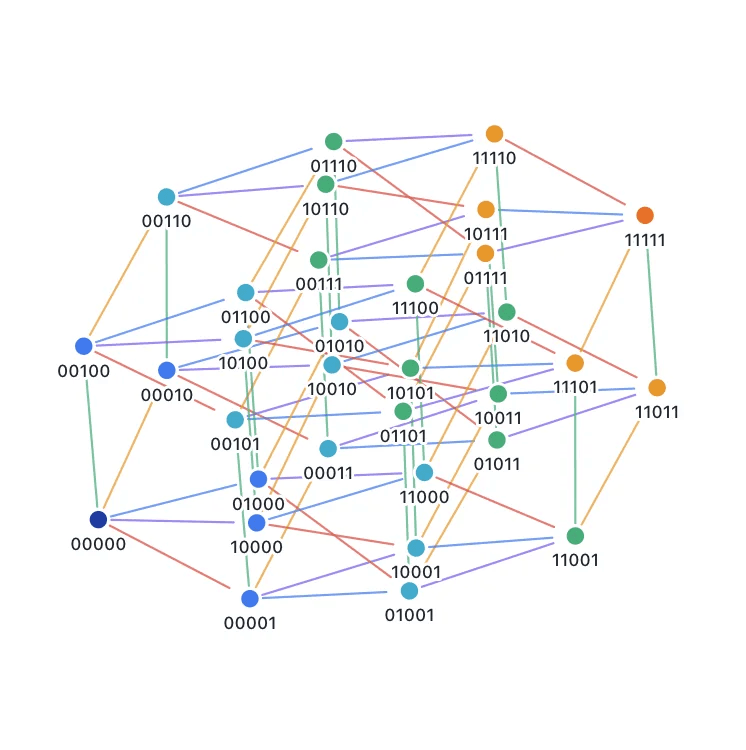
Interactively visualize hypercube graphs in arbitrary dimensions with a force-directed layout.
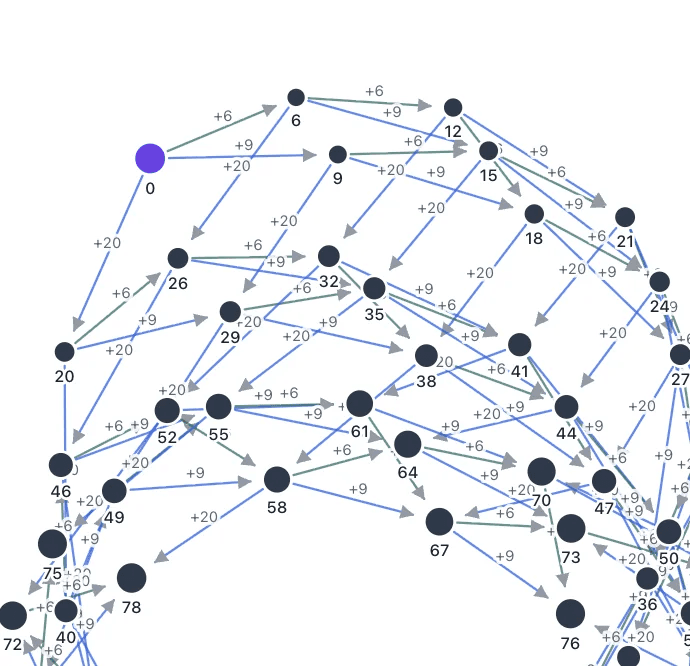
Step through a breadth-first search of the McNugget problem and watch the reachable totals fan out.
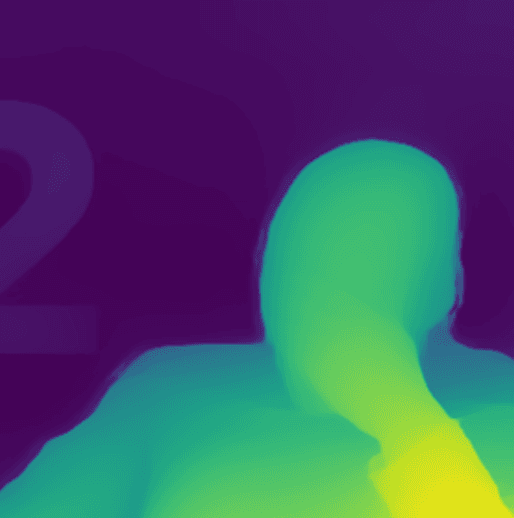
Upload a photo and visualize relative depth as a colorized map and interactive 3D point cloud.
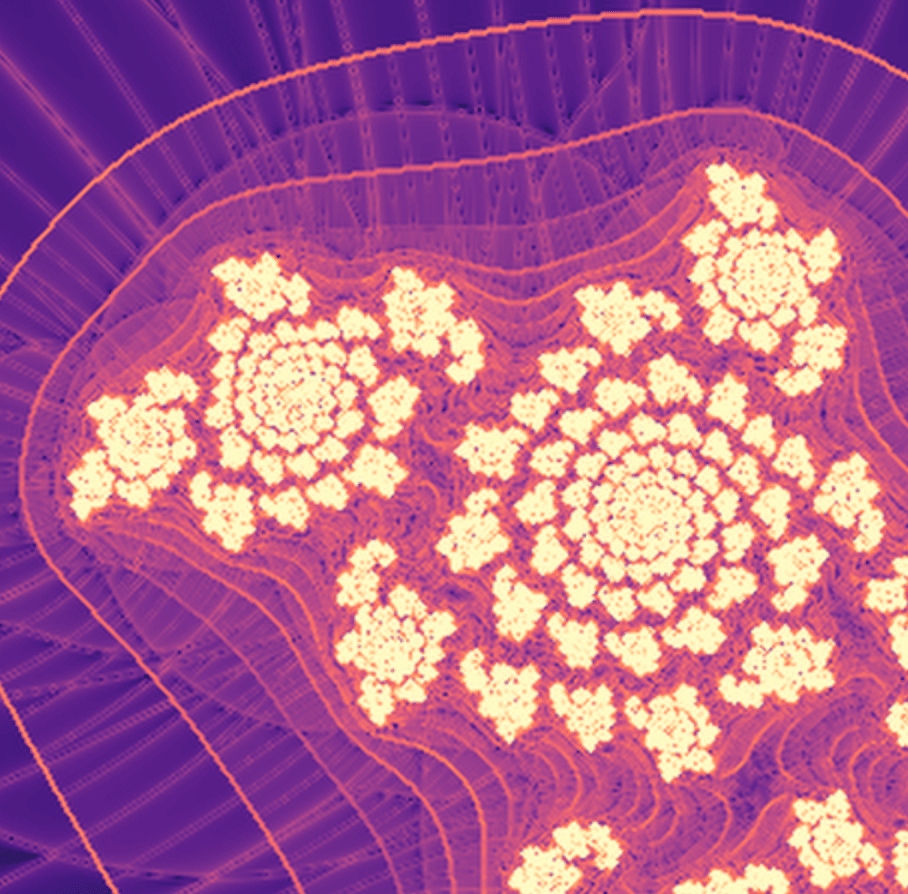
Visualize Julia sets of the map z² + c using discrete Lagrangian descriptors, with interactive parameters and animation.
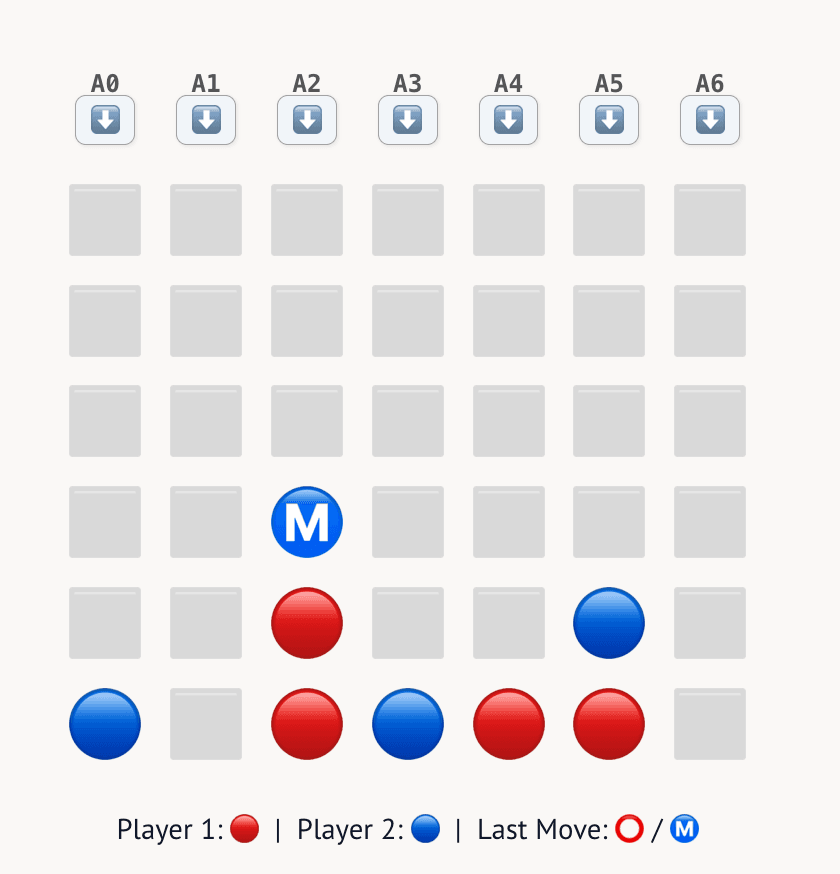
Explore Monte Carlo Tree Search step by step and play Connect 4 against an MCTS-powered bot.
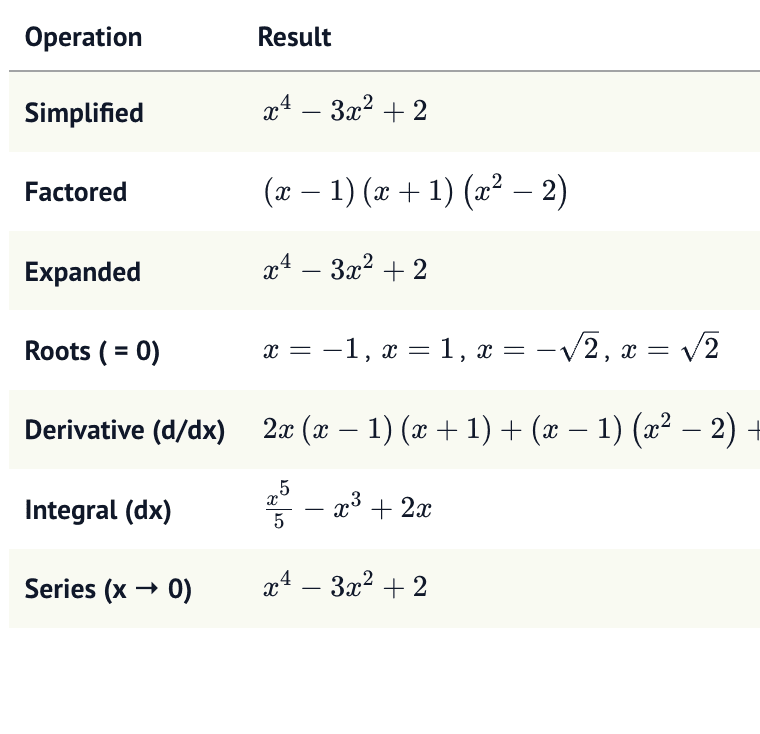
A tiny SymPy Gamma in a notebook: analyze an expression to get its simplified form, roots, derivative, integral, series expansion, and plot.
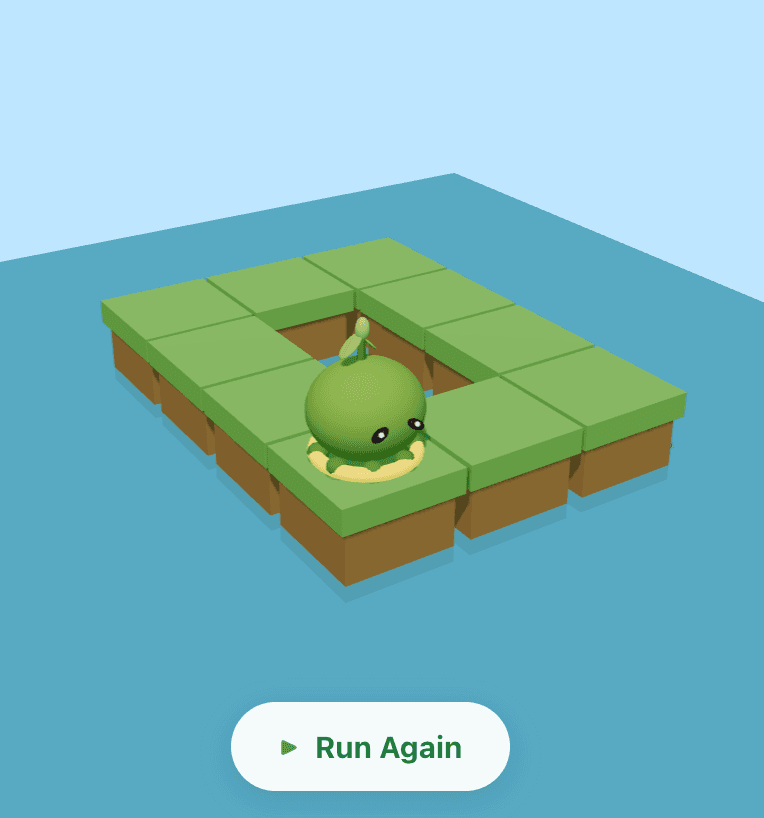
An interactive coding playground: guide Mo the Mossball through puzzle worlds by writing Python.
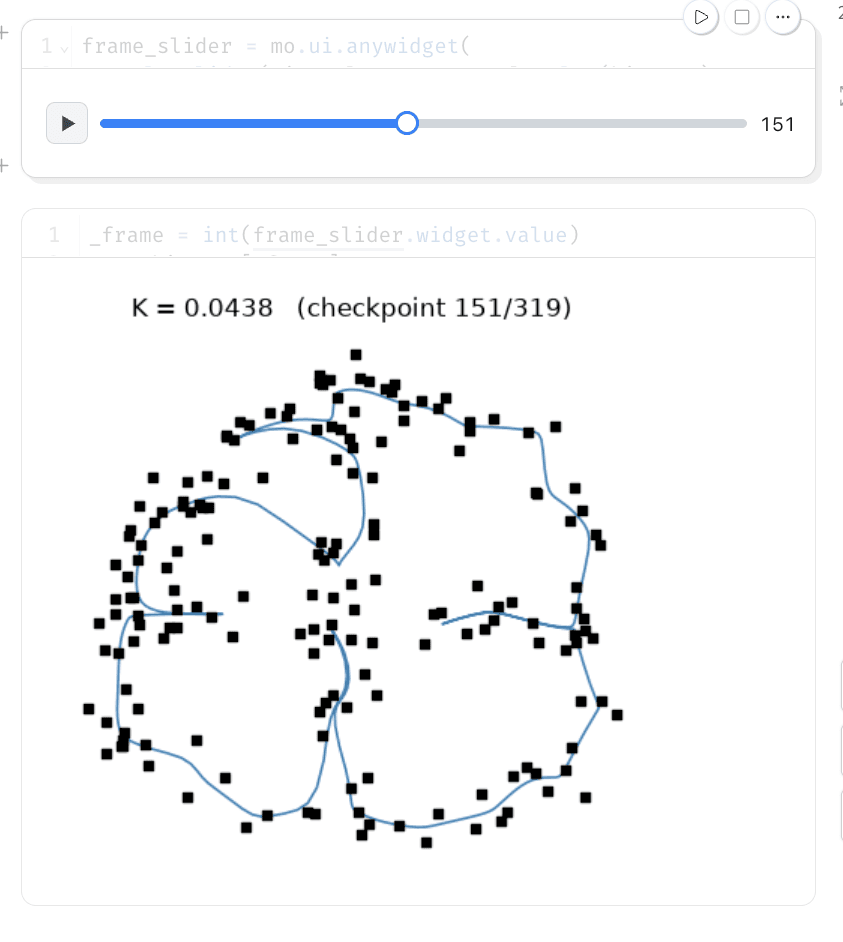
Draw a set of cities and watch Durbin & Willshaw's elastic net method unfurl a rubber-band tour through them.
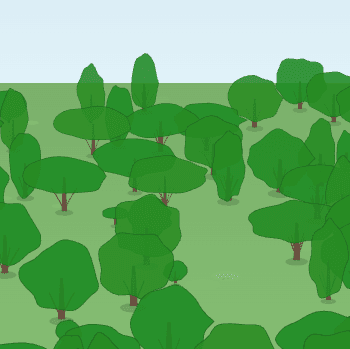
Explore tree-based ML ensembles as an interactive 2.5D isometric forest — trace predictions, drill into trees, sort by purity.
How language models represent statistics like mean and variance on curved activation manifolds, with steering experiments extended to geographic data.
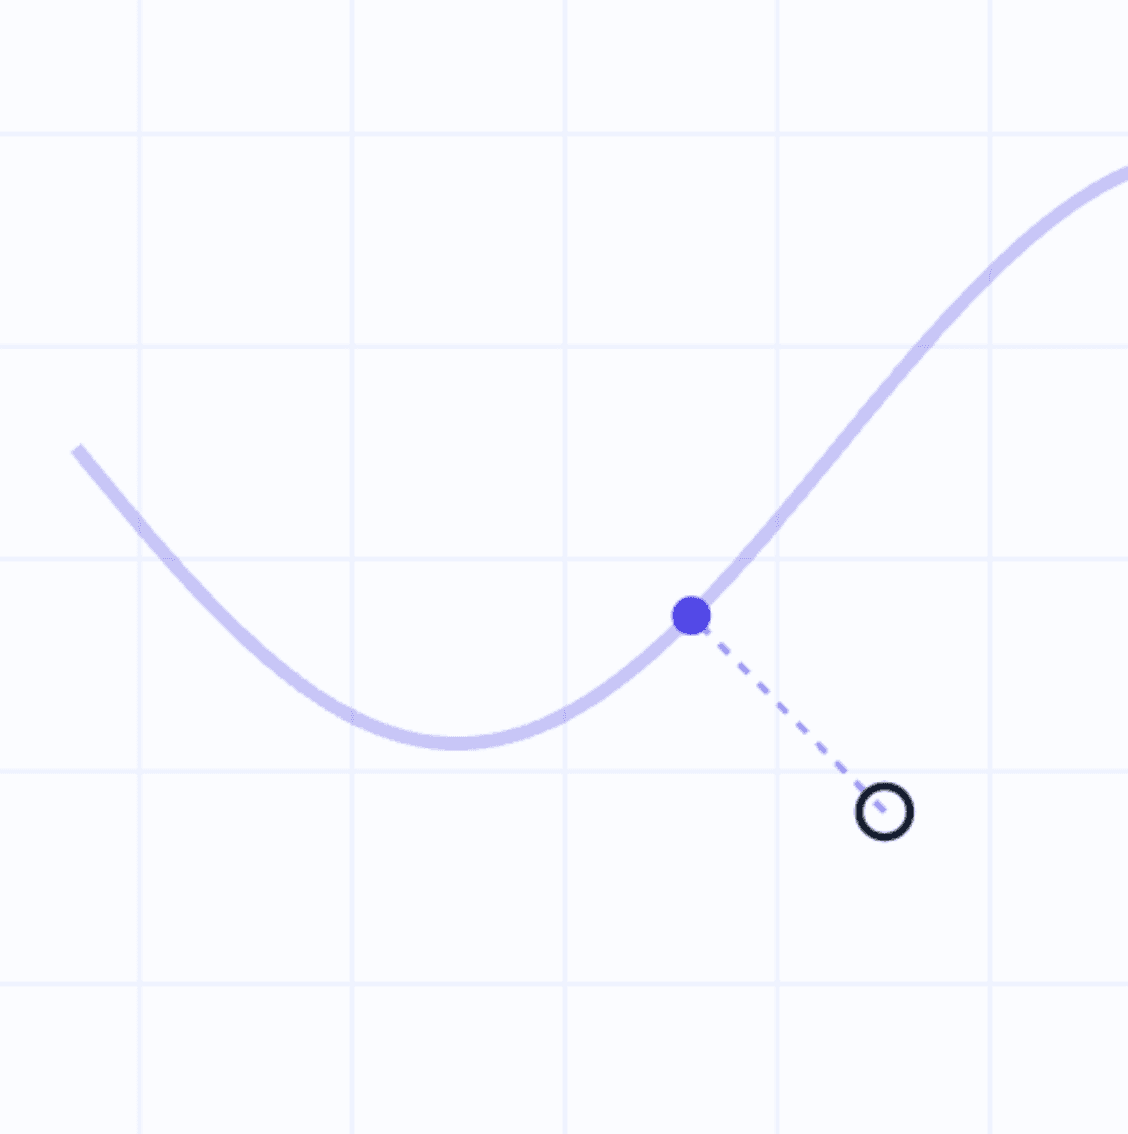
An interactive explainer of 'Back to Basics: Let Denoising Generative Models Denoise', showing diffusion models can predict clean images directly since natural images live on a low-dimensional manifold.
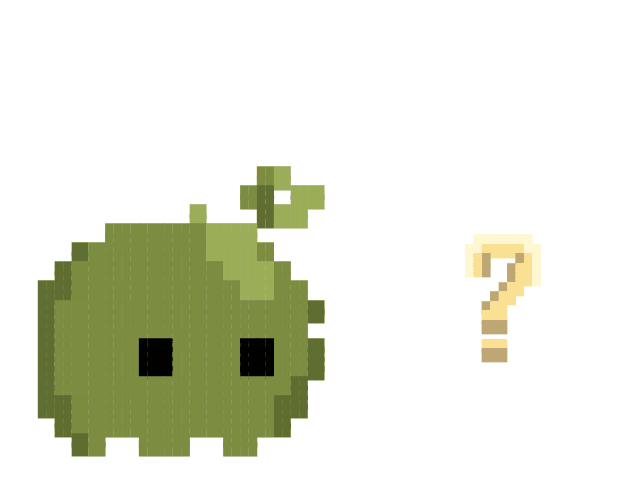
LLM-BabyBench: a benchmark evaluating LLMs' grounded planning and reasoning in simulated grid-world environments.
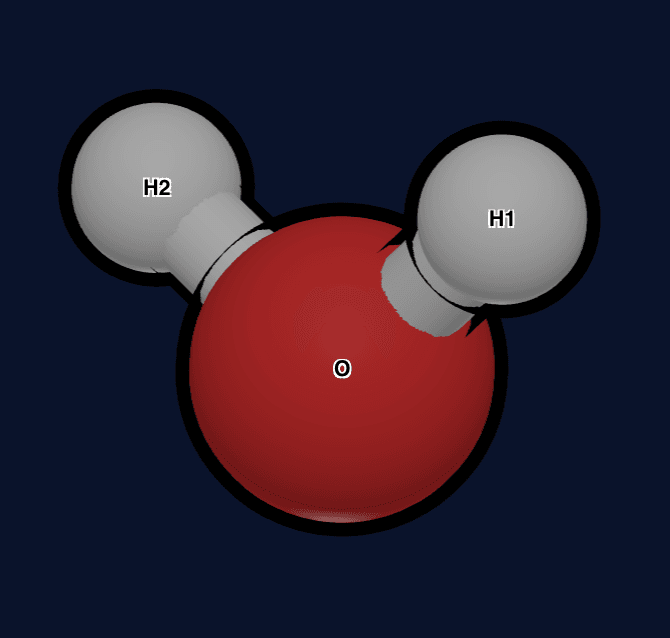
Animate and record a vibrating water molecule with marimol's 3D structure viewer.
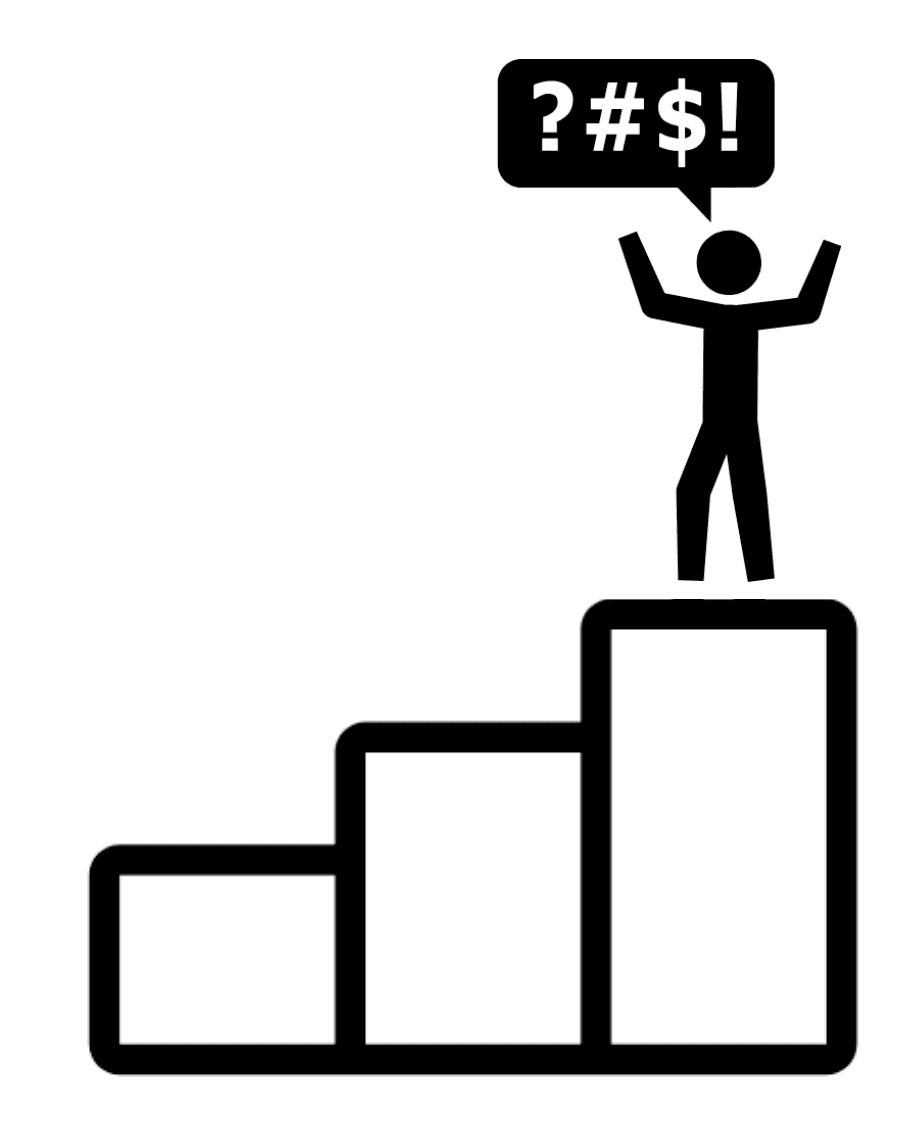
Simulate the winner's curse in a common-value auction and find the bid discount that removes it.
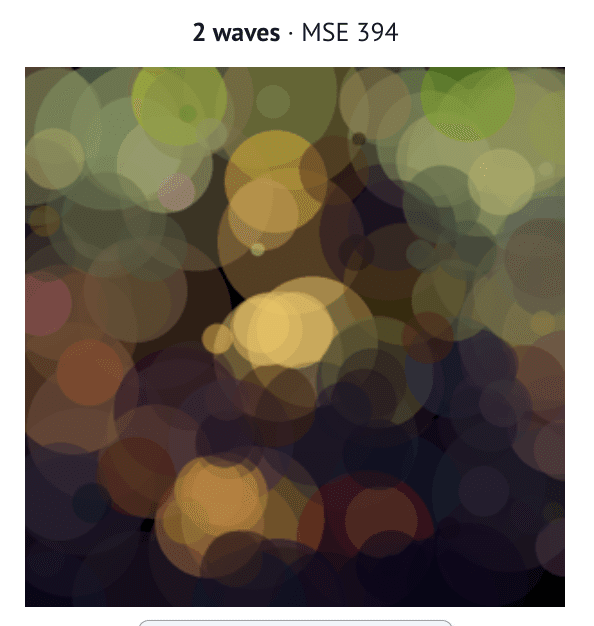
Rebuild an image from translucent circles or squares with a hill climber, and compare an all-at-once fit against a waves fit.
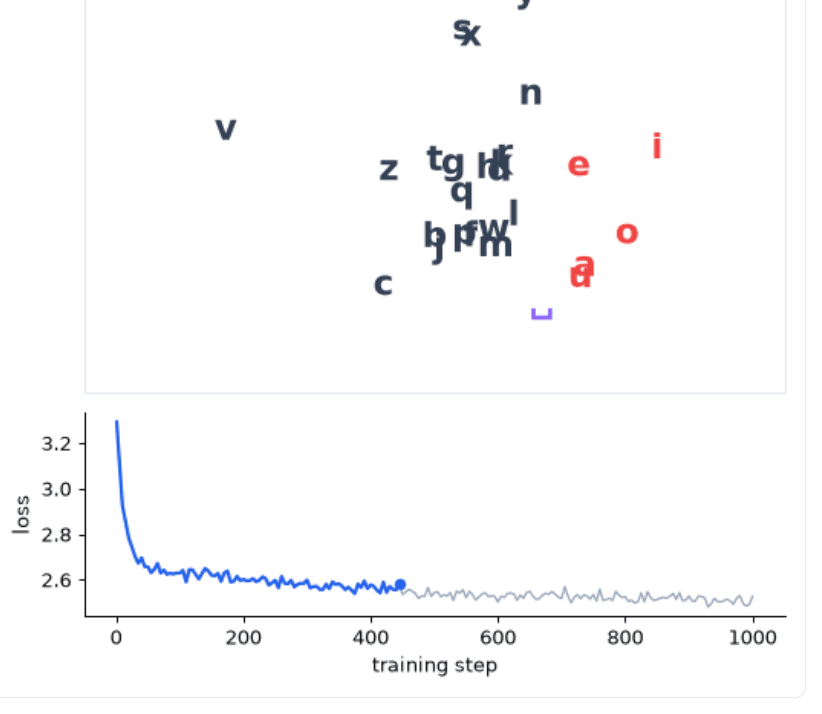
Train a tiny next-character predictor and watch a 2D embedding form for each letter.
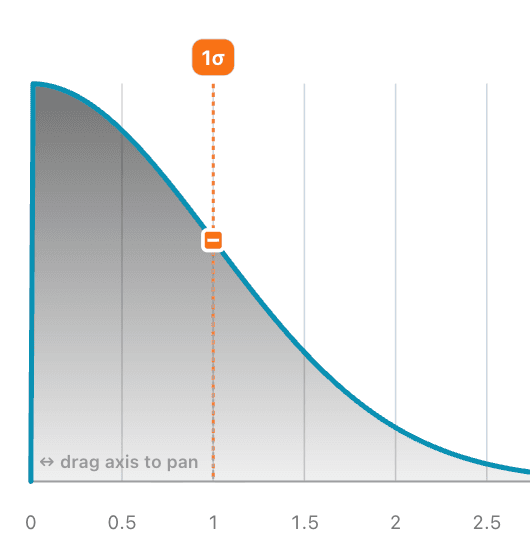
Drag the density curve to set your Bayesian priors, then hand them to scipy or PyMC.
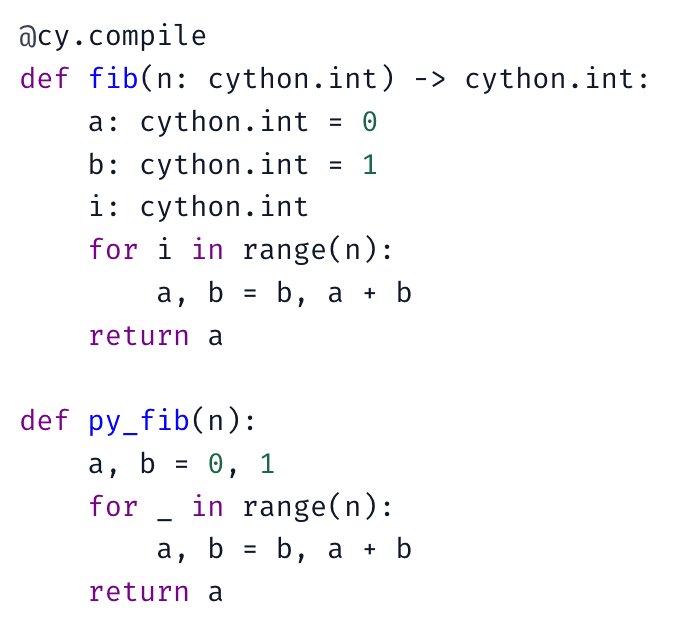
Compile Cython functions inside notebook cells with marimo-cython.
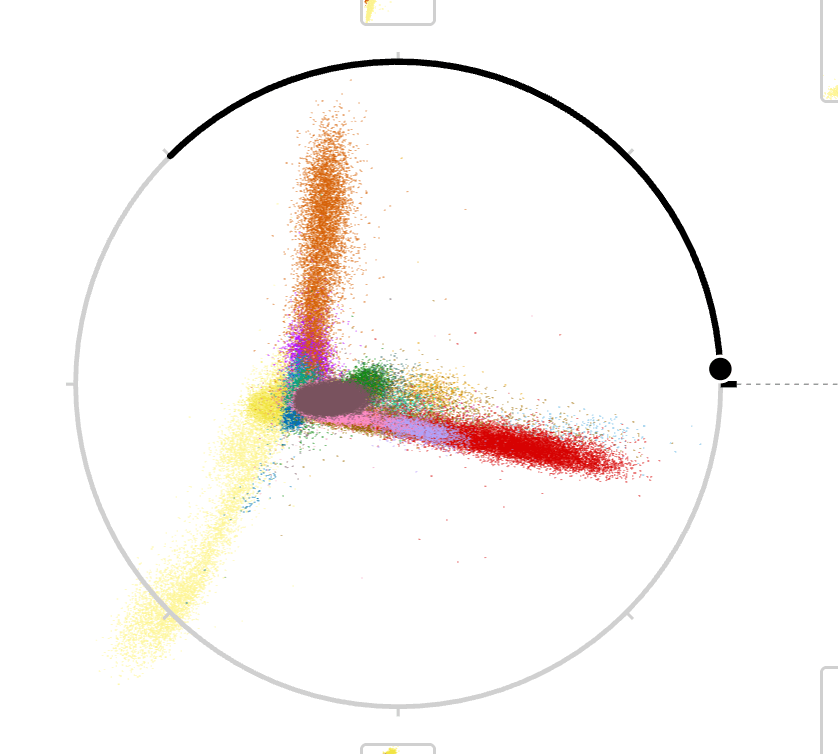
Animate through 2D projections of high-dimensional data and link the selections to other views.
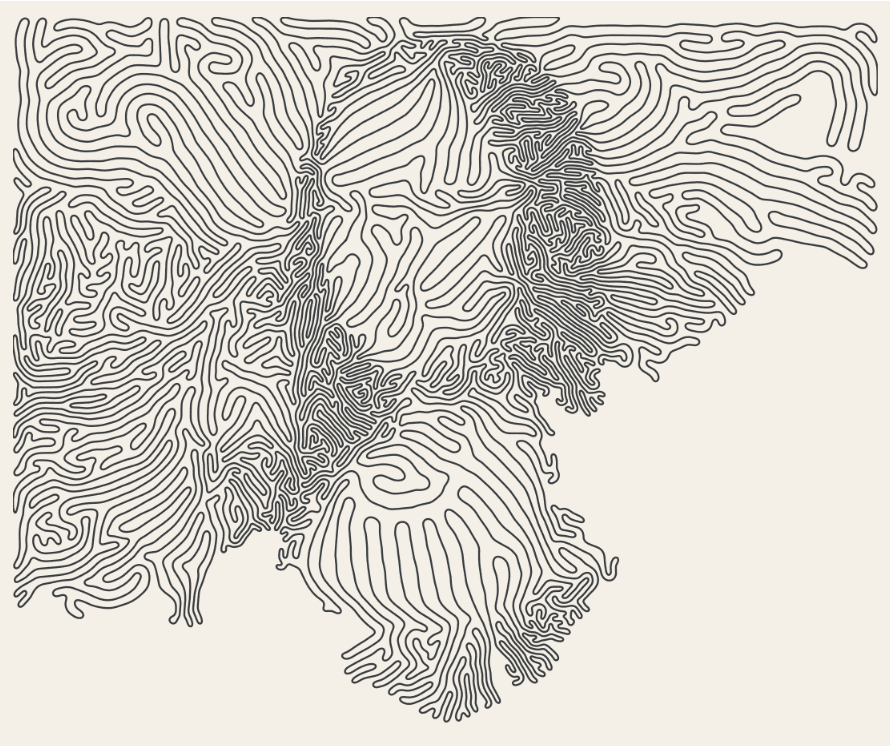
Draw a painting with one line that grows, folds, and never crosses itself.